")
")
Dividing by Four the CO2 Emissions from France in the Energy Sector: the Negatoe Scenario 2017
- Published on 26 February 2018
Dividing by Four the CO2 Emissions from France in the Energy Sector: the Negatoe Scenario 2017
Save the Climate by the Scenario Committee
Claude Acket, Hubert Flocard, Claude Jeandron, Hervé Nifenecker,
Henri Prévot, Jean Marie Seiler
Table of Contents
Foreword.............................................................................................................................................. 2
Introduction to Negatoe 2017.............................................................................................................. 6
- A) The Starting Point for France, the Situation in 2015...................................................................... 8
A 1) Primary Energy Supply per Resource for year 2015................................................................ 9
A 2) 2015 Final Energy Consumption per Usage in Mtoe............................................................... 9
A 3) Specific Point on Electricity in 2015 (TWh).......................................................................... 10
A 4) Specific Point on Renewable Energies in 2015..................................................................... 11
A 5) Carbon dioxide emissions in 2015 (energy sector)................................................................ 11
B ) The Negatoe Approach: Beyond the Accomplished Coal Phase-Out ......................................... 12
C ) An Outlook on the Future ........................................................................................................... 13
- D) Energy Demand Management: 2050 Target.................................................................................. 16
D.1 General Considerations........................................................................................................... 16
D 2: Residential Sector.................................................................................................................. 18
D 2.1: Heating........................................................................................................................... 19
D 2.2: Domestic Hot Water...................................................................................................... 23
D 2.3. Cooking.......................................................................................................................... 24
D 2.4. Specific Electricity Uses................................................................................................ 24
D 3. Tertiary Sector........................................................................................................................ 25
D 4. Industrial and Agricultural Sectors........................................................................................ 25
D 5 Transportation......................................................................................................................... 26
D 5.1. Initial Conditions and Trend.......................................................................................... 27
D 5.2 Future: Sobriety and Efficiency .................................................................................... 27
D 5.3. Replacing Oil: Biofuels and Electricity......................................................................... 28
D 5.4. Transportation Recap..................................................................................................... 30
D 6 Global Recap: Final Energy Demand..................................................................................... 30
- E) Carbon Free Energy Sources from Now to 2050.......................................................................... 31
E 1. Renewable Direct Heat Sources............................................................................................. 31
E 1.1. Biomass, Biogas, Carbonaceous Wastes ........................................................................ 31
E 1.2. Miscellaneous Heat Renewables Other than Biomass.................................................... 33
E 2: Direct Electricity Renewables................................................................................................ 33
E 2.1 Hydropower.................................................................................................................... 34
E 2.2 Wind Power..................................................................................................................... 35
E 2.3 Photovoltaic..................................................................................................................... 39
E 2.4 Various wastes, wood, .................................................................................................... 40
E 2.5 Overall Assessment of Electric Power Renewables........................................................ 40
E 2.6 What Should We Make of Decentralized Energy Systems?........................................... 41
E 3. Nuclear Power........................................................................................................................ 41
- F) Final Negatoe Wind Up................................................................................................................. 44
F 1. The Objective: Minimal Cost ................................................................................................ 44
F 2. A Gradual Approach to Achieve the Factor 4....................................................................... 45
F 3. Main Results of the Negatoe Wind Up.................................................................................. 46
F 3.1. Final Energy.................................................................................................................... 46
F 3.2. Electricity........................................................................................................................ 47
F 3.3: Supply, Primary Energy Resources, 2015-2050 Transition............................................. 49
F 3.4: Fossil Fuels and Carbon Dioxide Emissions....................................................................... 49
- G) The Financial Aspects: the Cost of the Energy Transition............................................................ 50
- H) Discussion..................................................................................................................................... 52
Acronyms........................................................................................................................................... 53
References.......................................................................................................................................... 55
Appendix 1: Electricity and Grid Balance......................................................................................... 56
Appendix 2: Electricity and Hydrogen.............................................................................................. 62
Appendix 3: Methane Production Modes.......................................................................................... 64
Appendix 4: Principal Economic Evaluation Hypotheses ................................................................. 66
Appendix 5: An Economic Comparison at the European Scale......................................................... 67
Appendix 6: Negatoe Variation: Towards Less Nuclear Power 69
Foreword
From Negatoe 2007 to Negatoe 2011, Negatoe 2014 and the 2015 energy transition law (loi de transition énergétique de 2015)
The 2005 energy transition legislation defined four main objectives for the French energy policy; these objectives remain current:
- Contribute to the national independence for energy and guarantee the security of supply.
- Ensure a competitive energy price.
- Protect the environment, in particular by mitigating greenhouse gas emissions
- Guarantee social and territorial cohesion by ensuring an access to energy for all.
In the frame of this legislation, France supports the international goal of dividing global greenhouse gas emissions by two by 2050[1], which requires a division by a factor[2] 4 to 10 of the emissions due to developed countries.
The 2005 legislation defines four major orientations for attempting to reach the objectives:
- Save energy.
- Decarbonate the energy consumed by reducing the fossil energy share.
- Develop renewable energy sources
- Continue with nuclear energy for electricity generation
At the national debate on energy of 2003 (débat national sur les énergies - DNE 2003) organized in preparation for the policy guideline law of 2005, we presented, under the name "fossil phase-out", what became, in 2007, a scenario based on the 2006 data that we subsequently renamed Negatoe. This scenario is consistent with the goals of the legislation and allows reaching the "factor 4". As it is, it applies to the situation in France but it could be adapted to the conditions of most developed countries.
This scenario is along the lines of the first energy transition operated by France in the years 1980-1990, during which nuclear energy replaced coal and oil in electricity generation, a first significant step towards energy decarbonation.
We called it "Negatoe" because, indeed, it is the consumption of energy produced in large part by fossil fuels, symbolized by oil and the tonne of oil equivalent (toe) that has to be managed[3]. Beyond energy conservation, without which the "factor 4" would not be attainable, fossil fuels must be replaced wherever possible by carbon free energies, whether for direct use, to produce heat, or to generate electricity.
In its Negatoe 2011 version, this scenario was presented by Save the Climate at the National Debate on the Energy Transition (DNTE - Débat National sur la Transition Energétique) that was held from November 2012 to mid 2013. Negatoe was placed in the DEC category and was one of the four trajectories retained in the debate overview.
- In the SOB family (SOB for sobriety), the Negawatt scenario with its total nuclear phase-out implies a 60 % reduction of per capita final energy consumption all sources taken together, and anticipates a 272 TWh final electricity consumption (compared to 432 TWh in 2015, i.e. a 43% per capita reduction in the electricity sector).
- In the EFF family (EFF for efficiency), the ADEME[4] scenario assumes a 51 % reduction of per capita final energy consumption for a total electricity generation of 381 TWh of which 265 TWh from renewables, 95 TWh from nuclear[5] and 21 TWh from natural gas.
- In the DIV family (DIV for diversified), the ANCREdiv[6] scenario anticipates a 17 % reduction of per capita final energy consumption. This scenario conforms to the government directive to reduce the share of nuclear energy to 50 % and reaches 250 TWh nuclear generation (in a total 510 TWh electricity generation).
- The DEC family (DEC for decarbonated via electricity) includes the ANCREele scenario and the scenario called Negatoe. The ANCREele scenario differs from the ANCREdiv scenario in that it maintains the contribution of nuclear power to about its present level, with a 750 TWh total electricity generation of which 420 TWh is nuclear (approximately today's value) and 316 TWh from renewables. As for Negatoe, it puts even more emphasis on decarbonated electricity, partly replacing gas for heating and oil for mobility. It disputes that, because of intermittence and variability, renewables will be able to take a predominant share in electricity generation. At the time, the scenario planned 908 TWh electricity[7] (+61% compared to the 2012 value), with 700 TWh nuclear (+64%) and 168 TWh renewables (+92%). Overall, the nuclear generation share is about the same as today's (77%) but its absolute value is increased. However, in terms of installed power, nuclear power accounts for a little less than half the total.
The National Debate on the Energy Transition allowed a comparison of different scenarios that all planned a division by 4 of the CO2 emissions, based on a more or less intense reduction of energy needs, on a combination of sobriety and efficiency, on the future of renewable energies and, more than anything else, because it is structuring, on the share of nuclear power in electricity generation, extending from complete nuclear phase-out (Negawatt case), through very little nuclear - actually equivalent to none (ADEME case), on to a little less or as much as today (ANCRE cases), to finally, with no preconception, increased nuclear power, as necessary in order to satisfy needs at lowest cost (Negatoe case).
During the debate, the French government gave clear indications concerning its preconceptions and orientations, leading to significantly reduced nuclear power. This was officially confirmed with the legislation: "Loi sur la transition énergétique pour la croissance verte" (Law on the energy transition and green development) approved and passed by parliament in July 2014, published in the Journal Officiel (official journal) in August 2015.
This law refers clearly to the fundamental goal discussed at the beginning of this chapter : 40% reduction of greenhouse gas emissions between 1990 and 2030 and division by 4 of greenhouse gas emissions between 1990 and 2050 and, quite consistently, stipulates that the fossil fuel generated primary energy consumption must be reduced by 30% in 2030 relative to the 2012 reference. We note the explicit qualifier fossil fuel.
But this law, by sometimes confusing the goals reaffirmed above and some of the means to reach them, goes beyond and engages specific actions. Such means are not all directly related to the fundamental goal of reducing carbon dioxide emissions and can, without being detrimental to the goal, not concern it directly or, even, be counterproductive. Thus, it puts forward, for instance:
- a 50% reduction of final energy consumption in 2050 relative to the 2012 reference, with a 20% intermediate goal in 2030.
- an increased renewable energy share, accounting for up to 23% of the gross final energy consumption in 2020 and 32% of this consumption in 2030.
Concerning the first item above, if reducing energy consumption is, indeed, essential if the factor 4 is to be reached, yet, within which limits and at what cost this reduction needs to be done should also be stated. Consumption reduction can be achieved at the expense of other more effective actions towards the reduction of emissions; conserving energy can turn out to be very expensive, in contradiction with the popular saying that energy that is not produced costs nothing. Conserving energy is not typically related to the principal goal, that of reducing carbon dioxide emissions. A significant emissions reduction can quite well be obtained with constant final energy consumption. Moreover, considering the connection between economic growth and energy consumption, barring considerable energy intensity advances, too large a reduction of the energy consumption can translate into economic decline synonymous with poverty and unemployment.
Concerning the second item, although there is total agreement for the development of renewables in general, yet it is necessary to be more specific. If this support need not be dubious, except for cost and, possibly, land use issues where thermal renewables (including biomass and solar generated domestic hot water ...) are concerned, it becomes debatable where electric power generating renewables are concerned such as wind power and photovoltaics, because of their costs but more so because of their variability and their intermittency. They require backup systems which, in the absence of acceptably efficient and inexpensive storage devices, lead to boosting natural gas power generators, thus defeating carbon dioxide emissions reduction.
It seems, though, that the real goal of this law is revealed through the actions aimed directly at nuclear power, thus catering to electoral objectives:
- reduce to 50% the share of nuclear power in the production of electricity by 2025.
- limit the total nuclear electricity production capacity to 63.2 GWe (note that this is the current capacity, before the new EPR type reactor being built in Flamanville 3 becomes operational).
Yet, if the decarbonation goal of our economy is to be reached, the large amounts of fossil energy consumed in transportation and buildings will have to be replaced progressively with carbon free electricity.
We have carefully examined the various means available to produce carbon free electricity while taking into account the stringent technical constraints that have to be complied with if a reliable and good quality electricity is to be provided. Because the intermittency of wind and photovoltaic power has to be overcome, the low cost power fleets allocate a large share to nuclear production and will continue to do so. That is how electric power generation will best preserve consumer purchasing power and will provide industry with a competitive edge relative to foreign competition.
This is why, in keeping with previous work, we propose this 2017 update of the so-called Negatoe scenario. It does not conform to the 2015 legislation where the specific nuclear issue is concerned but it has its full place in the debate, in that it brings it back to the primary objective: reducing carbon dioxide emissions by a factor 4.
Introduction to Negatoe 2017
Negatoe directly addresses the four main energy policy goals which are more than ever on the agenda.
- Contribute to national independence for energy and guarantee security of supply.
- Ensure a competitive energy price.
- Protect the environment, in particular by mitigating greenhouse gas emissions, this being put forward strongly at the Paris COP21[8].
- Guarantee social and territorial cohesion by ensuring an access to energy for all.
Negatoe defines four major lines of action to help reach the goals specified:
- Energy conservation. Moderation, encouraged and made acceptable to all but within limits excluding coercion and, more important, Efficiency which generally requires large investments but these should have a reasonable payback period.
- "Decarbonate" the energy consumed by reducing the share of fossil energies[9], in order to achieve the factor 4 division by 2050, then proceed further to reach zero emissions by the end of the century. Nuclear power has replaced coal[10] and heavy oil in the 1980s-1990s for electricity generation in France. The task remains, now, to replace oil and natural gas in all their other uses.
- Develop renewable energies, distinguishing thermal from electricity generating renewables.
- Keep nuclear power for the generation of electricity without a priori excluding its extension along the lines of what was achieved during the first true energy transition of the 1980s and 1990s that witnessed the end of coal and heavy oil in the French electricity mix.
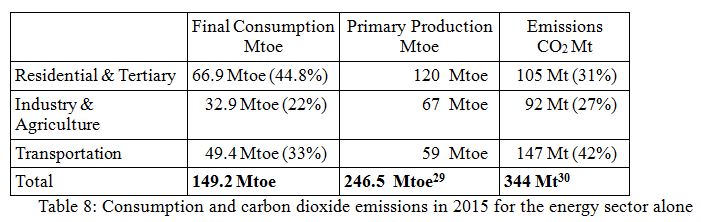
In the first chapter (A), we present the energy situation as it stands in 2015 and discuss the estimation of carbon dioxide emissions related to the energy sector in France, viz. 344 million tonnes.
In the second chapter (B), we show that France has already traveled a long way towards reducing its carbon dioxide emissions with the development of nuclear power in the years 1980-1990, and the quasi total phase-out of coal and heavy oil. This achievement deserves to be analyzed and its lessons learned so as to proceed further and now reduce natural gas and oil consumption.
In the third chapter (C), we discuss a so-called reference scenario, one which could be implemented in semi continuity with the present, were it not for the imperative division by 4 of fossil fuel use.
In the fourth chapter (D), we deal with demand management in the 2050s. We discuss the moderation issues (individual and collective endeavors towards demand reduction) and the efficiency measures liable to reduce carbon dioxide emissions for a given demand.
In the fifth chapter (E), we review the potential of the different carbon free energy sources (renewables and nuclear) in satisfying the demand with no carbon dioxide emissions.
In the sixth chapter (F), we recapitulate the main Negatoe scenario data for 2050, along with the state of the final energy demand for each energy source; we examine electricity with special attention and assess the carbon dioxide situation.
In the seventh chapter (G), we estimate the cost of the Negatoe energy transition via a simplified economic approach.
Preliminary Remarks:
- 1. Energy occurs in many forms (heat, mechanical energy, electricity). It is measured with a standard unit regardless of its form, i.e. the Joule and its multiples (MJ, GJ[11], ..). In practice, however, professionals, because of the leading role played by oil, have adopted the toe, for tonne of oil equivalent, as their reference unit, along with its multiples (toe, Mtoe, Gtoe) for all thermal energies, and the kWh and its multiples (MWh, GWh, TWh) for electricity:
1 toe = 41.86 GJ (often rounded off to 42 GJ)
1 MWh = 3.6 MJ or 0.086 toe
Although electricity and heat do not serve the same purposes, the international and national organizations that deal with energy have agreed to express in toe the energy made available to its users, called "final energy", whether the energy is thermal or electric. We generally adopt this convention here, given that our purpose is to examine the evolution of consumption and of the means to satisfy the demand. Per capita or per household consumption, however, will often be expressed in kWh, a more convenient unit in these instances.
From Final Energy to Useful Energy
Final energy is, according to convention, the energy made available to the user for a price.
By summing her/his bills for electricity, gas, oil (for heating) or gasoline (for the car), etc a consumer can calculate his/her final energy expenses in financial but also in energy terms, i.e. how much final energy is consumed. This final energy fulfills the energy needs in that it provides the useful energy, i.e. the energy that remains once the losses are subtracted; for example, a gasoline combustion engine's efficiency can be as low as 30 %. Thus, only 30 % of the so-called final energy really moves the vehicle. On the other hand, an electric engine on the same vehicle has an efficiency that can reach 90 % so that the final energy will be enough to travel three times as many miles. Indeed, useful energy is the issue and with minimal carbon dioxide emissions.
Taking another approach, instead of considering losses, additional input can be taken into account, with pumped energy. Indeed, final electricity can be used by heat pumps to pump energy from nature that will come as an addition to the electricity. Again a particular advantage of electricity that is to be taken into account.
Conversely, in the assessment of CO2 emissions, quite obviously, the tonnes of fossil fuels that have effectively contributed to making the final energy tonnes available are the quantity that must be examined. The former are somewhat in excess of the latter where the final use is heat production (taking oil as an example, the energy consumed in refining and conveying the fuel to the end user represents 10 to 20 %) but, in the case of electricity, it is twice to 3.3 times as much (taking thermal efficiency into account in the conversion of heat to electricity[between 33 and 60 %], the losses on the grid, and the consumption of auxiliary production equipment).
Once these so-called "primary" energy amounts are evaluated, the pertaining CO2 emissions, or rather their carbon content expressed in terms of tonnes of carbon (tC and its multiples), can be assessed by applying the standard coefficients[12]:
- Oil: 1 toe yields 0.89 tC
- Coal: 1 toe yieds 1.17 tC
- Natural gas: 1 toe yields 0.74 tC
The conversion from tC to tCO2 is obtained by multiplying these values by 44/12=3.65
The conversion of 1 toe of fossil fuel generated electricity to tC (or tCO2) is obtained by dividing by the thermal efficiency of the production unit[13].
- 2. With this paper, we aim at an initial evaluation of the various factors that contribute to the "energy mix" and CO2 emissions[14].
A) The Starting Point for France, the Situation in 2015
As discussed above, the Negatoe 2007 and 2011 versions were based on the 2006 data. The onset of the recent financial crisis (early summer 2007) and the collapse of Lehman Brothers (in September 2008) whose effects are still with us, have totally disrupted the data, affecting both the GDP and the energy consumption in unforeseen ways. Indeed, while in 2007 the real Gross Domestic Product was growing at a rate of 2.3% per year, it was declining by 0.1% per year in 2008 and by 3.1% in 2009. These downturns were compensated with difficulty thanks to a return to growth: 1.7% in 2010, 2% in 2011, but only 0.2% in 2012 and 0.6% in 2013 and 2014 and, finally, 1.3% in 2015.
Concerning energy, the extent of the crisis can be measured in terms of final energy consumption which declined from 161.7 to 149.2 Mtoe in 2015 (-7.7%). This reduction does not result from voluntary energy management measures but reflects an economic decline leading to unemployment, loss of purchasing power and the associated social consequences.
Given this situation, a clear vision of what the future holds requires basing this Negatoe 2017 version on the 2015 data[15].
A 1) Primary Energy Supply[16] per Resource for year 2015
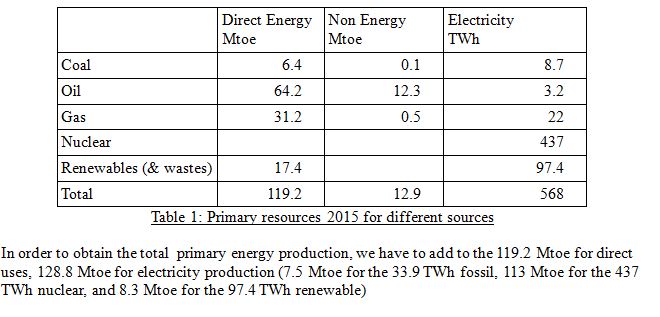
Table 1: Primary resources 2015 for different sources
In order to obtain the total primary energy production, we have to add to the 119.2 Mtoe for direct uses, 128.8 Mtoe for electricity production (7.5 Mtoe for the 33.9 TWh fossil, 113 Mtoe for the 437 TWh nuclear, and 8.3 Mtoe for the 97.4 TWh renewable)
Fossil fuels account for 109.2 Mtoe in primary production. A factor 4 division would imply doing away with almost 90 Mtoe, either by reducing global needs by the same amount, all sources included, or by replacing them with carbon free sources, for direct heat production and electric power generation.
Note: In a global perspective, the summing of direct heat energy and electricity to obtain what is called primary energy measured at the production outlet, implies conventional conversions which, in France, are based officially on the energy content rule. The conversion defines the amount of reference fossil fuel (oil) that would be consumed to produce 1MWh. The values are 1MWhe of nuclear electricity is said equivalent to 0.26 toe, 1 MWhe of fossil fuel electricity is said equivalent to 0.222 toe (apart from situations where the mass of fossil fuels consumed is given directly in toe units). For renewables, as they cannot be referred directly to heat, conventionally, they are referred to their potential calorific energy when used (final energy) so that 1MWh of renewable electricity (non thermal) is said equivalent to 0.086 toe, 3 times less than nuclear power. With these conventions, the total primary energy is 248.2 Mtoe, of which 119.2 Mtoe direct heat (with 101.86 fossil) and 129 Mtoe electricity (of which 7.3 Mtoe fossil).
These conventions, which were established to quantify the primary energy of nuclear and non thermal renewable electricity are frequently questioned; they do not put forward the advantages of a source, nuclear power, that does not emit carbon dioxide. If the same conversion rule based on final energy consumption were applied to all sources other than fossils, i.e. to all carbon free sources, the primary energy total of 248.2 Mtoe quoted above would now be 184.4 Mtoe[17].
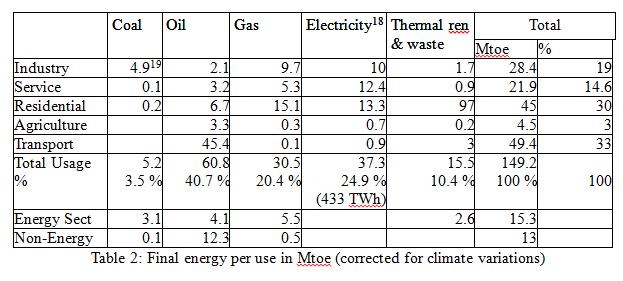
A 2) 2015 Final Energy Consumption per Usage in Mtoe
A 3) Specific Point on Electricity in 2015 (TWh)
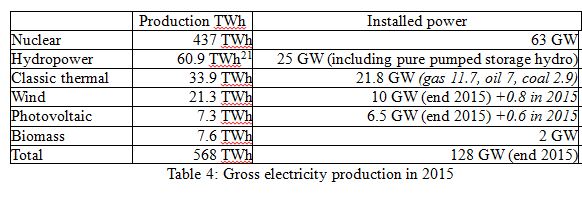
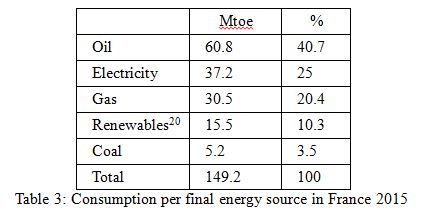
The 37.2 Mtoe for electricity stated in Table 3, final energy appraisal for 2015, correspond to 433 TWh (37.3 x 11.63) electricity at the end of the line on the distribution grid.
Tracing back to the gross production of 568 TWh (at the output of the production plants) includes the self consumption of the production units: 30 TWh, the export-import balance: 62 TWh, the pumped storage consumption: 8 TWh for 6 TWh produced, and line losses: about 35 TWh (roughly 7% of the energy transported).
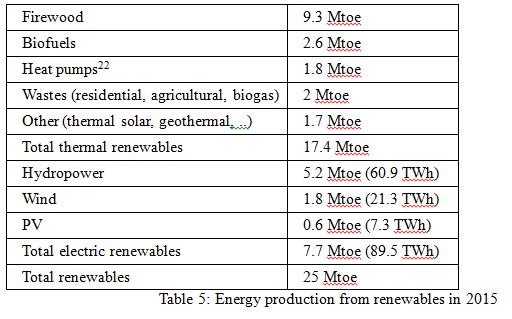
A 4) Specific Point on Renewable Energies in 2015
Fossil energies, a source of carbon dioxide emissions, account for almost half (46%) of the total primary energy sources and about 2/3 (65%) of direct use final energy, rising to 66% when the share of fossil energies consumed by the energy sector is included.
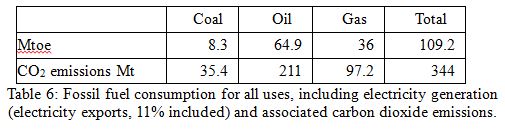
The carbon dioxide emissions due to these energies are given in the table below, along with the 2015 demand for these fuels. The emissions equivalence used is (cf. the preliminary remarks in the Introduction):
- Coal: 1 toe yields 1.17 tC
- Oil: 1 toe yields 0.89 tC
- Natural gas: 1 toe yields 0.74 tC
The conversion from tonnes of carbon, tC to tonnes of carbon dioxide, tCO2 is obtained by multiplying these values by 44/12=3.65.
Note:
Of the 344 million tonnes CO2 emitted, only 41 Mt are due to electricity generation. These emissions would be increased by 434 Mt, i.e. more than doubled, to reach a total of 778 Mt if nuclear power were to be replaced by a fifty-fifty mix of coal and gas; a remarkable result of the energy transition effected in the 1980s and 1990s.
To obtain the global CO2 emissions of France, we have to add the non energy related uses of 13 Mtoe fossils (see in Table 2) which would emit 41 Mt CO2.
B ) The Negatoe Approach: Beyond the Accomplished Coal Phase-Out
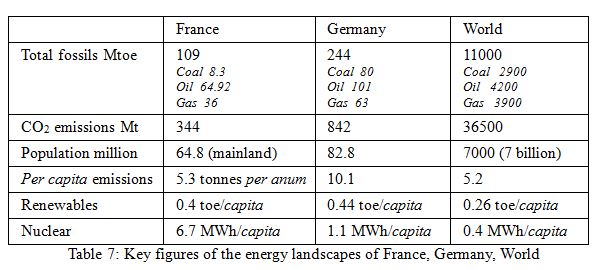
As shown in Table 7, France stands out from Germany, so close geographically, so similar in its standard of living and the per capita GDP, yet so different in the relative shares of coal, nuclear, renewables.
This particular situation of France (not unique, it is true also, for example, of Switzerland or of Sweden where nuclear and hydro power coexist) is the result of the energy transition in the years 1980-1990 in response to the oil crises. The transition led to the phasing out of coal and heavy oil and their replacement with nuclear power in the production of electricity so that the per capita[23] carbon dioxide emissions of France for energy production[24] as a whole are about 50% lower than those of Germany[25].
Note the close similarity of the German energy landscape with that of the rest of the world regarding the shares of the various components of the energy mix. Admittedly, the per capita emissions of France are somewhat larger than the world average; but, like the Chinese emissions, they tend to draw closer to it. In spite of this, at the European level and with a lack of subtlety, the same effort, namely the factor 4, is required of each member of the Union. If a factor 4 is applied to France, the factor for Germany should be on the order of 7.5, assuming constant population; in the event of an expected decline of the German population and growth of that of France, the factor for Germany should be even larger.
A successful first step towards fossil phase-out has been taken in France and an initial direction has been identified. The Negatoe scenario proposes to continue along the same lines, not for the sake of principles, nor because of rigidity or obstinateness, but because this route proves to offer the best energy security and least cost for households and for public finances, as well as the best competitiveness for businesses. Thus, Negatoe proposes to replace a large chunk of the oil and gas consumed for transportation and in building services with carbon free electricity produced at the least cost possible.
C ) An Outlook on the Future
In semi continuity, a reference, "Business as Usual" (B.A.U.)
Looking back on the past it is possible to attempt an outlook on the future, barring fundamental changes, whether these are voluntary or not. Figure 1 shows how the significant parameters that determine the energy landscape and carbon dioxide emissions have evolved in the recent past, starting from a 100 index for 1960, and, anticipating on their future evolution, shows the direction in the Negatoe approach.
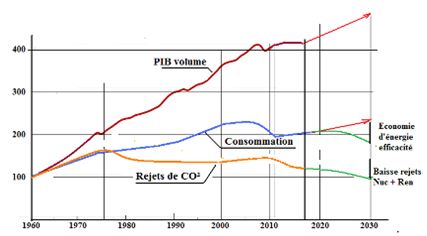
Figure 1 - Evolution of the GDP, energy consumption and carbon dioxide emissions for France; base 100 in 1960
By choosing 1960 as the starting date, the middle of the 30-year post-war boom, we highlight the effects of the oil and financial crises on the energy landscape.
Note, in the figure, the correlation of the evolution of the GDP with that of energy consumption, one following the other with more or less elasticity according to energy efficiency improvements. This efficiency improvement (ratio of the energy consumption growth rate to the GDP growth rate) was clear after the oil crises and the consequence of the indexing of energy costs to those of oil[26]. It dropped from about 0.75 to 0.63.
Figure 1 is very informative regarding the evolution of CO2 emissions. We note that they increase constantly up to the late 1970s, in parallel with increasing consumption and, beginning in the 1980s, they start to decline. This reversal is the consequence of nuclear power plants being brought into operation between the end of the 1970s and the end of the 1990s (from Fessenheim 1 in 1977 to Civaux 2 in 2000). It is also related to the increasing share of electricity in final energy consumption with, in particular, direct electric heating, in general associated to careful thermal isolation which is appreciated today[27]. This allowed a 15% reduction of CO2 emissions while final consumption increased by 25% between 1985 and 2009.
Nuclear power alone would account for 32% of the emissions gain. A first significant step, a guide if the overall objective for 2050 is to gain 75%.
Proceeding further, from now to 2050, in continuation with the objective of dividing carbon dioxide emissions by 4, implies making hypotheses on the evolution of the GDP and consumption.
The previous version of Negatoe referred to a "business as usual" type scenario (like the SR2008 scenario established by the DGEMP[28]) that hypothesized a 2.1%/yr growth of the GDP and a population of 70 million in 2050. This led to reaching 226 Mtoe final energy consumption in 2050 with 184 Mtoe in 2020, barring a radical change in the share of fossil energies, i.e. ignoring the factor 4 constraint. 184 Mtoe in 2020 meant a 23% increase with respect to the real situation in 2015 (149.2 Mtoe, see Table 2).
The financial crisis (early summer 2007) and the collapse of Lehman Brothers (September 2008) with the lasting effects that we still experience today, in particular in France, have completely disrupted the landscape with unforeseen changes in the GDP and energy consumption data. Indeed, while in 2007 the French GDP increased by 2.3%, it declined by 0.1% in 2008 and, more, by 3.1% in 2009. These drops are somewhat compensated, with difficulty, by a return to growth, +1.7% in 2010, +2% in 2011 but again, 0% in 2012 and a meager +0.3% to +0.4% from 2013 to 2016.
From the energy aspect, the extent of this crisis is visible on the primary energy evolution which, instead of increasing somewhat from the 276 Mtoe of 2006 declines to 260.1 Mtoe in 2015 (-5.7%). Similarly, final consumption drops from 161.7 Mtoe in 2006 to 149.2 Mtoe in 2015 (-7.7%). These declines do not result from voluntary energy consumption reductions but reflect a certain economic regression with its corollary unemployment and loss of purchasing power and their social consequences.
A more realistic 1.5%/yr GDP growth hypothesis from now to 2050 leads to a 70% GDP increase with respect to 2015. Assuming that the energy intensity, which is still improving, will vary from (about) 0.7 today to 0.5, the final energy consumption increase is 30%, leading to a 200 Mtoe final energy consumption in 2050. This could be the reference, in the absence of any specific supplementary actions taken to reach the factor 4, besides those already undertaken in the wake of the various crises we have known.
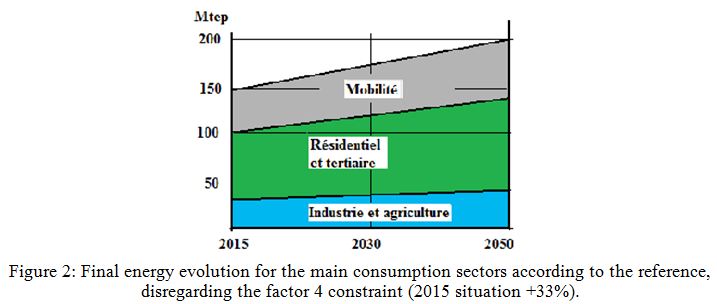
Figure 2: Final energy evolution for the main consumption sectors according to the reference, disregarding the factor 4 constraint (2015 situation +33%).
Continued fossil fuel consumption with the same trend is, obviously, incompatible with a factor 4 division of CO2 emissions. It's a long way to the factor 4; efforts will lead first to a stabilization of the emissions, before reducing them massively. Clearly, the longer we procrastinate, the more intense the effort will have to be. But actions must be undertaken in an orderly fashion; with spending directed to cheaper carbon emission reductions; taking into account investment payback and discount rate issues as well as potential technology improvements.
Overall, the reference scenario foresees significantly increased CO2 emissions, demonstrating the need to correct the consumption and energy production trajectories. Wherefore the Negatoe scenario approach, as illustrated in the figure below.
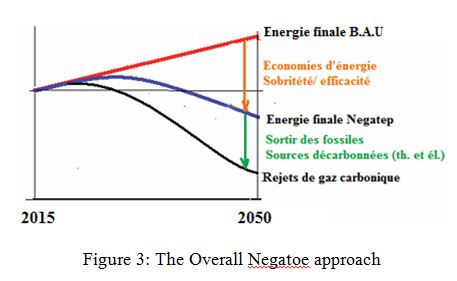
Figure 3: The Overall Negatoe approach
D) Energy Demand Management: 2050 Target
D.1 General Considerations
As already stated in the foreword, although reducing consumption is necessary to reach the factor 4, the real objective is carbon dioxide emission reduction and reducing consumption is only one of the means. Indeed, carbon dioxide emissions can well be significantly reduced while keeping final energy consumption constant.
Final energy needs have constantly increased (excepting a few short crisis related intervals, soon forgotten in the ensuing economic upswing), because of population increase and to the "forever more" per capita, as illustrated in Figure 1 for France. We hypothesize a population growth (for mainland France, from 64 million in 2015 to 72 million in 2050, i.e. +13%). In order to divide CO2 emissions by 4, if the substitution of fossil energies by carbon free sources is not sufficient, the per capita consumption will have to decline, in contradiction with past trends. This implies energy sobriety and efficiency.
- sobriety: individual wisdom that is satisfied with less, hopefully not enforced either directly by authoritarian measures or indirectly by financial constraints (to the point of being detrimental to health). Sobriety could, for example, lead to lower heating temperatures, smaller per capita residential surfaces (requiring less heating), more walking, more bicycle riding, using more public transportation, ... according to individual choices.
- efficiency: better satisfy the same needs by improving the yield of processes, in particular by recovering energy wastes ... Efficiency rests mostly on technology, creativity, industrial know-how. Housing insulation is one of its aspects.
The drive for better efficiency often comes with a significant cost, raising the issue of how to best allocate available resources. Keeping in mind that the purpose is to reduce CO2 emissions, measures should be selected according of their cost per tonne of avoided CO2. As a case in point and a quite actual one, should investments in renewable electricity production, such as wind turbines and solar photovoltaic panels be pursued, given that they do not significantly impact carbon dioxide emissions (or if they do, it is adversely), rather than investing in the insulation of buildings, including those heated with natural gas that could also switch to carbon-free electric heating in association with heat pumps where possible.
Qualitatively, the management of needs leads to monitoring the evolution of the data summarized in Table 8, i.e. consumption, production and emissions in the main occupational sectors in 2015. Note that these data do not necessarily evolve in parallel, they can even be opposed, one declining while another increases. Everything boils down to setting the number one objective and, in this instance, it is clear: reduce greenhouse gas emissions, in particular fossil fuel contributions.
The term efficiency mentioned above is explicitly stated in the very widely publicized European slogan "three 20 targets". In the European Union's climate-energy package adopted in 2008, one of the three 20s reads:
- To increase energy efficiency to save 20% of EU energy consumption by 2020.
The other targets are:
- To reduce emissions of greenhouse gases by 20% by 2020 taking 1990 emissions as the reference
and
- To reach 20% renewable energy in the total energy consumption in the EU by 2020.
For France, the three 20 targets are developed as:
- 20% reduction of greenhouse gas emissions
- 20% energy conservation by 2020
- 23% renewable energy in the final energy consumption mix[31]
Note:
While the EU text refers to efficiency, France mentions energy conservation. The two are quite different, efficiency being evaluated relative to the real GDP. If, for example, a country enjoys a 22.5% GDP increase over 15 years (+1.5%/yr) a 20% efficiency gain would translate, according to the EU phrasing, into a 2.5% energy consumption increase and, according to the French phrasing, a 20% reduction.
Unfortunately, in the setting of quantitative objectives in the form of the three 20s, a confusion is introduced between the objectives and the means. Merging the reduction of energy consumption with prescriptions on the share of renewables and greenhouse gas emissions reductions can lead to contradictory choices and environmental and economic nonsense. The same contradictions are there in the 2015 energy transition legislation as discussed above in the prologue. It is sometimes the case that a reduction of greenhouse gas emissions entails more primary energy (for example, electric heating from carbon free electricity or district heating with biomass compared to individual gas heating). Another example: replacing natural gas or oil fueled heating with firewood increases the final energy consumption but reduces CO2 emissions.
The Negatoe scenario introduces a hierarchy in the three 20 targets: there is only one target, the reduction of CO2 emissions and there are means, comprising decreased consumption and carbon free energy production. There is an additional objective: reduce CO2 emissions at least cost.
Since the Negatoe scenario does not retain CCS (Carbon Capture & Storage - see § F for the reasons) reducing CO2 emissions implies reducing the share of fossil fuels. After having phased-out coal and heavy oil (see § B), the consumption of gas must be reduced (essentially for heating) as that of oil (essentially for mobility and freight transport).
D 2: Residential Sector[32]
Responsible for 30% of the total final energy, the residential sector is the second energy consumption sector, just behind transportation (33%). However, with only 21% of the carbon dioxide emissions, it is far behind transportation (42% of total emissions). This is because of the relatively larger share of carbon free electricity (coal phase-out has already been accomplished) in the stationary residential uses (electric heating) and in industry as compared to mobility which relies practically 100% on oil, and where the transition remains to be done.
In mainland France, the 34.5 million dwellings comprise 28.4 million principal residences, 3.2 million secondary residences, and 2.8 million vacant dwellings. The number of occupied dwellings increases by about +1%/yr. In the reference scenario and in the Negatoe scenario, this value is retained. It is somewhat larger than the population increase, 0.4%/yr, (+8% by 2050). The mean residence area is 91m2. The per capita area was 35m2 in 1996, it is now 42m2 per capita[33]; this increase is expected to continue, whether in the reference scenario or in the Negatoe scenario, to reach 45m2 per capita: we do not consider restrictive measures such as decreeing apartment sharing[34].
Of the 34.5 million dwellings, 20 million were built before 1974, prior to the first legislation aimed at reducing energy consumption (consequence of the first major oil crisis). Another 9 million were built between 1975 and 1998[35] and 5 million were built since 1999. In recent years, about 300 000 new residences were built per year. With an average 50 000 per year residences torn down, the net increase is 250 000 per year or a 0.7% increase, larger than the 0.35%/yr population growth. In keeping with these tendencies, the total number of residential buildings in 2050 would be 43 million, the value retained also for Negatoe in 2050.
Insulation renovation work on residential buildings at the rate of 300 000 per year seems likely. Note that this renovation work can cover simple actions such as installing insulation in the attic all the way to the more complex total insulation[36]. Depending on the extent of the renovation work, a factor 2 to 4 improvement can be obtained[37].
In the reference scenario, the number of residences with reduced energy consumption, including new and renovated residences, would increase by 550 000 per year. Among the residences built before 1974, "heat sieves" or energy voracious residences would be eradicated[38].
Negatoe must proceed further, increasing the rate of new residential construction (400 000/yr) and of residence tearing down (150 000 per year) and, more important, the number of renovations: 400 000 per year; with better efficiency, to tend towards the factor 4 improvement mentioned above. Note that approximately 5 million residences require prompt action.
In 2015 the total final consumption in the residential sector was 45 Mtoe (522 TWh), distributed as follows: gas 32.1% (168 TWh); electricity 31.6% (165 TWh); oil 14.5% (76 TWh); firewood 15.5% (81 TWh); other 6.4% (wastes, LPG, coal)[39]. Today's average energy consumption, 190 kWh/m2.yr (17 500 kWh/yr per principal residence) would, in Negatoe, be reduced to lie between 100 and 50 by 2050 and sooner if possible. Heat represents about 62% of the energy needs in the sector, domestic hot water 12.1%, cooking 6.9% and specific electricity uses 18.9%, this last item increasing the fastest.
D 2.1: Heating
D 2.1.1 The situation today
- The consumption for heat amounts to 330 TWh (28 Mtoe). 50% of residences are heated with gas[40], 23% with electricity (direct heat, heat pumps excluded), 4% with district heating, 8% with firewood[41], 3% with heat pumps.
- 1.6 million residences are not equipped with heating devices, or only with summary means (cooking stove, independent devices such as mobile backup electric radiators, or - mostly open - fireplaces).
- The average consumption for heating is variable:
- For recent apartment buildings (year 2000) about 5 000 kWh/yr up to 8 000 kWh/yr for older buildings (1975 and earlier)[42]
- For recent individual houses (year 2000) about 11 000 kWh/yr, up to 25 000 kWh/yr for older ones (1975 and earlier).
D 2.1.2. What Does the Future Hold - Sobriety?
According to the legislation (of which the 1979 decree touting the abolition of wastefulness "chasse au gaspi") the interior temperature of dwellings should be kept at 19°C or below. This is not put in practice and mean temperatures of 21°C or even 22°C are frequent. Given that each additional degree represents a 7% consumption increase, it is tempting to decide that calling on civic mindedness, good will, education and a little enforcement, our consumption could be reduced by 15 to 20%. Clearly, the 19°C regulatory temperature does not coincide with the desired comfort zone of the majority[43]. This can only get worse with population aging. Only a significant energy price increase could, in the coming years, induce a reduction beyond 10%, and that would be for lack of funds.
D 2.1.3. Thermal Insulation of Dwellings and Renovation
Preliminary Comment:the flaws of the RT2012[44] that should be corrected urgently
Among other things, the thermal regulation sets, rightly, a limit to the energy consumption of buildings. Initiated in 1974, it has been constantly stepped up in its successive versions (1988, 2000, 2005 and finally 2012). Initially based on the final energy consumption in kWh/m2.yr (pointing directly and unambiguously to the dwelling's thermal losses and the quality of its insulation, tangible for the user who can monitor his kWh or, for gas, m3 consumption on his utility bills), from 2000 on, they were based on the primary energy consumption (a notion that is not directly accessible to the consumer), i.e. no longer on the quality of the dwelling itself but on the heating mode chosen. Electricity is then disadvantaged by a factor of about 2.6 and thus condemned indirectly while this heating mode is, in France, responsible for minimal carbon dioxide emissions since the electricity is produced essentially from nuclear and hydro power. The new RTs up to 2005 adapted this shift to primary energy by indirectly taking into account the effect of carbon dioxide emissions: two different primary energy limits were established according to the heating mode, with or without electricity. But this last item was completely deleted in the RT2012[45], disregarding the priority specified by the "Grenelle de l'Environnement[46]": limit carbon dioxide emissions. This new RT2012 does not include a limit on CO2 emissions, contrary to the recommendation of organizations such as the OPECST[47]. Unambiguously, the RT2012 fosters natural gas heating, thus inducing a carbon dioxide emissions increase.
Should the RT2012 be declared illegal?
Irrespective of the cost aspects which fall under the responsibility of the consumer, State legislation should impose only one criterion: the annual carbon dioxide emissions in kg per m2.
Since most of the electricity would be carbon free, Negatoe retains, for all needs (heating and other needs) the 50 kWh/m2.yr for new constructions and 100 kWh/m2.yr for older dwellings, as measured in final energy (not primary energy), as in the first few RTs.
- a) Heating, New Housing
The RT2012 thermal regulation requires 50 kWh/m2.yr primary energy on average in new housing[48]. While previous regulations took into account the low carbon dioxide emissions of electricity, RT 2012 makes no exception for dwellings heated by electricity (directly or with heat pumps). Note that this primary energy limit includes not just heating but also lighting, domestic hot water, and any auxiliaries (pumps and fans) via a "Cepmax[49]" coefficient. If, for electric heating, this limit requires heat pumps with a mandatory investment that represents no emissions gain, it is quasi unattainable for gas heated dwellings if the limits on carbon dioxide emissions are taken into account[50]. With a mere medium sized carbon tax, gas heating would be practically eliminated.
Given this situation, Negatoe retains a 50 kWh/m2.yr final energy consumption (not primary energy). This is the consumption today of well isolated, electrically heated, recently built housing. For the 14 million new constructions from now to 2050, this comes to 65 TWh, the value retained in Negatoe, in continuity with current new building construction.
- b) Heating in Older Housing & Renovation
An analytical approach is difficult given the variety of situations, building standards having evolved significantly, in particular in 1988 and 2005. The J. Orselli[51] report differentiates older housing (built before 1975), housing built between 1975 and 1995, and housing built since 1995. He takes into account older housing that has been torn down (a few %) and distinguishes two categories.
- Approximately 1/3 of older dwellings (nearly 6.7 million) are heated with electricity; they are generally well insulated (7MWh/yr final energy per dwelling or a total of 45TWh/yr).
- The other 2/3 are heated with other energy sources (about 20MWh/yr final energy per dwelling, or a total of 335 TWh/yr). These 335 TWh/yr include 95 TWh/yr (8.2 Mtoe) renewable energy (essentially rather inefficient wood-burning[52]) and 240 TWh/yr (20.5 Mtoe) fossil fuels.
In order to scale these 240 TWh (20.5 Mtoe) of fossil fuels down to 35 TWh (3 Mtoe) J. Orselli considers two scenarios and suggests a third one.
- One where renovation work is done at one go, aiming to reach very high quality insulation (opaque walls, double flow ventilation, well insulated glazing,...), drawing on the technology developed for new housing.
- One with so-called "diffuse renovation" that takes advantage of regular maintenance work to improve insulation by using good materials and techniques (windows, window and door frames, modern furnaces, ...)
- The third that combines diffuse renovation with a larger share of renewable energies and electric heating (but the report does not specify the conditions).
The first option runs the risk of very high costs, above 30 000 €[53] per dwelling[54], to reduce fossil consumption by only 3/4, scaling it down to 5MWh/yr per dwelling (a total of 60 TWh). To reach the 35 TWh/yr target, renewable energies or electricity should participate as a complement; we admit 2/3 renewable and 1/3 electricity.
With the second option, the fossil fuel heating needs for existing housing could be reduced by 50%[55], scaling them down to 10 MWh/yr on average (about 120 TWh total); the extra charge over and above the regular maintenance work would be small (on the order of 10 000 €) and easily compensated thanks to smaller fuel bills (and CO2 bills in the event of a real carbon tax). On the other hand, this option requires a significant increase of carbon free energy.
This comparison of the costs in the two scenarios is a perfect illustration of the decreasing efficiency rule: a 10 000 € investment reduces the demand from 20 to 10 MWh/yr per dwelling (useful energy) while a 30 000 € investment is needed to reduce it from 20 to 5 MWh/yr. So in some situations, depending on the final target, the investment to save one MWh may be close to 3 times as large, and the marginal investment to scale down from 10 to 5 MWh/yr may be 6 times as large[56].
The third option leaves things quite open. One possibility could be to supplement diffuse renovations with the addition of direct electric heating that is switched off during peak hours (peak shaving), the existing furnace taking over (a sort of hybrid heating system). This would significantly reduce fossil fuel consumption (by nearly 90%) while keeping existing furnaces in place[57]. Another possibility would be to combine diffuse renovation with renewable energy input in association with heat pumps, a solution that is likely to be more expensive but would offer greater flexibility to adapt to various situations. This is the path that Negatoe follows, proposing medium scale renovation to scale the final energy demand down from 200 to 100 kWh/m2, thanks to a 15 000 €/dwelling[58] investment (see § G for the total cost). Based on 400 000 renovations per year, i.e. a total 20 million dwellings renovated by 2050, the energy consumed to heat these renovated dwellings would be 182 TWh (instead of 380 TWh today).
Note: the Negatoe approach takes the Jevons paradox into account[59]
As previously stated, no specific action other than standard maintenance is considered for dwellings that are already well insulated, mostly electrically heated, and conform to the regulations prior to the RT 2012 (new constructions), i.e. 45 TWh. The heating total for dwellings, then, is 290 TWh, from which the energy relative to "fatal" sources such as cooking and a fraction of the specific usages (lighting, multimedia, ...) can be removed. We retain a total of 270 TWh (23.2 Mtoe) for heating, but point out that if it relied widely on heat pumps (see § D.2.1.4), the share of electricity would be 100 TWh.
D 2.1.4. Heating Energy Sources in the Residential Sector
To maximize the phasing out of gas and oil we are led to promote
- heat pumps (ideal for new constructions but also valid for renovations, including air source heat pumps)
- direct electric heating, already in use in new buildings
- hybrid 'peak shaving' electric heating as a complement to an existing oil or gas heating system where the fossil fuels (which can be stored) are used only during the limited peak demand periods
- biomass, assuming the quasi complete replacement of existing hearths with for instance: heavy large volume efficient wood burning stoves, wood pellet stoves. The large scale use of biomass to produce heat is dedicated as the base fuel for heat networks. Should individual firewood heating become widespread, particle filters are to be recommended; they are already installed in collective heating boiler rooms equipped with new biomass furnaces.
Note that little is expected from solar heating, as opposed to strong expectations for domestic hot water production (see § D.2.2). While domestic hot water is used all year round, solar heating for a dwelling would bring only little heat in the time of year when it is most needed and a lot when it is not needed at all, thus providing mediocre investment payback.
D 2.2: Domestic Hot Water
In 2015, the demand for domestic hot water amounted to about 59 TWh (an average of 2050 kWh per dwelling) with 27 TWh (46%) from electricity, 23 TWh (39%) from gas, 5 TWh (9%) from oil. The trend is an increasing per capita demand (+1%/yr) to which a +13% expected population increase by 2050 should be added. Proceeding from an awareness campaign where showers are promoted rather than baths and water flow management is encouraged, we posit that only the population growth will increase the demand, reaching 66 TWh in 2050. Energy sobriety cannot be enforced at the expense of health and good hygiene.
The transition away from gas and oil will occur thanks to solar thermal energy (solar water heating), heat pumps and also existing hot water tanks which, because they operate in low electricity demand periods, are compatible with a global view of "intelligent" and flexible electricity management[60].
D 2.3. Cooking
In existing housing, cooking represents about 34 TWh (15 TWh electric and 19 TWh gas) or about 1 200 kWh per dwelling. Assuming an evolution in parallel with the population, it will amount to 38 TWh in 2050, mostly electric.
D 2.4. Specific Electricity Uses
The demand for specific electricity uses amounted to 93 TWh in 2015, representing an average 3300 kWh per dwelling (including only principal residences)[61]. This amount results from a 150% increase over 20 years due to the basic equipment of households with "white products" (household electrical appliances: freezer, clothes dryer, dishwasher, microwave oven, ...) with an acceleration to reach +10 % per year in recent years. Add to this "brown products" (audiovisual media: TV, DVD player, console, Hi-Fi system, decoder, ...) and "gray products" (computer, printer, Wi-Fi, ...). Globally, the efficiency improvement of individual appliances, tending towards A+ grading, does not compensate for the increased number of appliances, nor for their increasing use. For 2050, we consider that, thanks to technological progress (better efficiency), there will be no increase due to the population growth and the diversity of usages. We keep the demand at 93 TWh.
Note:
Whenever an attempt is made at conserving electricity in its specific uses, one must make sure that, in return, the heating needs are not augmented; in the first analysis, one can consider that a significant part of specific electricity uses generates heat. This holds for all the appliances during the heating season and, in particular, for lighting.[62]
Recap: Residential Sector Demand 467 TWh (40.2 Mtoe)
This 467 TWh final energy consumption in 2050 is to be compared to the 695 TWh (522 x 1.33) of the reference scenario (a 48% global saving, that translates into a 66% saving per capita).
Comments:
- The Negatoe choice concerning energy efficiency (about 100 kWh/m2 final energy for renovation and 50 kWh/m2 for new constructions) does not necessarily lead to the least expensive solutions, considering today's price for the different energy sources. Various studies, in particular by Henri Prévot[63], show that an even more marked reliance on electricity would turn out less expensive. In Negatoe, we have chosen a balanced approach between energy efficiency and thermal renewables, for its better long term robustness.
- Similarly, the UFE - Union Française de l'Electricité (trade association for the French electricity sector) has examined the payback ratio of various energy efficiency solutions; they vary widely; UFE recommends that priorities be set keeping in mind that an investment with better payback will carry with it the possibility of later financing a less profitable, but useful investment[64].
D 3. Tertiary Sector
Office space, stores, education, administration, health, social action, sports, ... for a 1 000 million m2 total area (about 1/3 of the residential surface).
Existing equipment divide up as 50% gas, 23% electricity, 20% oil, 2% biomass, 4% networks. The final energy consumption in 2015 amounts to 254 TWh (21.9 Mtoe)
Heating and hot water production, technically comparable to those of the residential sector, account for a little more than half the above demand, the rest being consumed in specific electricity uses, similar to those of the residential sector. Electricity, then, represents 45% of the final consumption and gas 33% (mostly for heating with 46% of the surfaces).
The reference scenario foresees about 29 Mtoe (338 TWh) in 2050. The Orseli[65] report notes the large diversity of situations in the tertiary sector but considers several paths for its energy management, in particular:
- Apply the best technologies available in renovations and for new buildings, as in the residential sector (base 50 and 100 kWh/m2.yr).
- Manage intermittent occupation of many premises (offices, schools and sports equipment, stores, ...)
Air conditioning should increase in this sector more than in the residential sector but this trend cannot be really evaluated.
Given these qualitative elements, we consider that in this sector as in the residential sector, and contrary to the reference scenario which anticipates a 33% increase of the demand in the tertiary sector, the demand in the tertiary sector could decline by 10% total, i.e. 20% per capita, relative to the situation today.
The Negatoe objective to reduce fossil fuel consumption translates here into total oil phase out and the quasi total elimination of gas, both being replaced by thermal renewable energies for half the share and electricity for the other half, either using direct electric heat or via heat pumps. The connection of large tertiary facilities to heat networks should be actively promoted.
Recap: Tertiary Sector Demand - 254 TWh (21.9 Mtoe)
D 4. Industrial and Agricultural Sectors
In 2015, the industrial and agri-food sectors consumed 32.9 Mtoe (382 TWh) with 28.4 Mtoe (330 TWh) for industry (including 4.7 for steel industry and 4.5 for agriculture. Industry consumed 38 Mtoe in 2002 and 37 in 2006. This sector was the most severely impacted by the economic crisis, with a decline to 28.4 Mtoe in 2015, as already mentioned. This decline is not due to improved energy efficiency, contrary to the decline of the 1980s, it is a direct consequence of the financial and economic crisis and of continuing de-industrialization that had already begun before the crisis. Industry had already worked hard at improving its energy efficiency after the oil crisis of the 1970s as shown in Figure 4[66].
Note, in particular, the development of variable speed motors[67], of recovery exchangers[68], ...
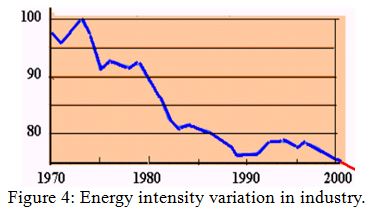
Figure 4: Energy intensity variation in industry.
While the trend would result in 38 Mtoe in 2050 for industry, can we still hope for efficiency gains?
These would be limited, as the improvements that were most accessible both financially and technically have already been implemented between 1975 and 1990, with a 25% gain over 15 years. We arbitrarily posit a 10% energy efficiency improvement between now and 2050. However, considering further industrial development likely[69], advantaged by the availability of competitive electricity thanks to nuclear power, the more so if oil prices return to higher levels, the total Negatoe consumption for industry in 2050 is kept at its 2015 level, i.e. 28.4 Mtoe. Large industrial energy consumers will probably rely increasingly on electricity, even for the elaboration of raw materials. This tendency will be reinforced as the price of fossil energies increases. The share of renewable energies should also increase (in particular in agriculture where biodiesel could partially replace heavy oil); it could reach 10%.
For agriculture, considering moderate efficiency improvements, we set the consumption at 4 Mtoe for Negatoe in 2050.
The resulting total for the industrial and agricultural sectors is 32.4 Mtoe in 2050.
Note: we should add to this total the needs that could arise from the biofuel industry, which is discussed in § D 5 (self consumption by the industry in the biofuel manufacturing process).
D 5 Transportation
Transportation today relies almost exclusively on oil. While it accounts for 33% of the final energy demand, it is responsible for 42% of the carbon dioxide emissions. No replacement energy sources are available today, nor in the near future at a large scale. Nevertheless, significant technological progress has allowed striking efficiency improvements in car combustion engines. A 2003 new car model emits 20g/km less CO2 than the 1995 model (12% gain)[70]. Up to the 2008 economic crisis, however, this improvement has been more than counterbalanced by stricter safety and anti-pollution legislation for substances other than CO2; by a consumer preference for more powerful vehicles; by more automobile traffic. The 2008 oil crisis has had a stronger psychological impact in the United States than in Europe. In France, it is the financial and economic crisis that has had consequences, with a scaling down of freight transport, but only slower growth, or quasi stabilization, of passenger transport. Governmental action in favor of low CO2 emitting cars (bonus-malus) has contributed significantly to reversing the trend.
D 5.1. Initial Conditions and Trend
In 2015, freight and passenger transportation can be characterized by:
- 323 Gtkm (Billion freight tonne-kilometers)
- Road 281; Rail 25; Waterway 8
with a significant crisis related reduction (-11% with 363 Gtkm in 2005)
- 928 Gpkm (Billion passenger-kilometers)
- Private vehicles 738; buses & coaches 71; rail 104; air 14 (domestic flights).
The rate of increase is small but has been continuous over 10 years (876 in 2005, i.e. +6%). The financial and economic crisis has had little impact, high oil prices having already been well incorporated in behavior.
The final energy consumption total is 49.2 Mtoe. Individual cars account for 25 Mtoe (with on average a little less than 2 passengers per vehicle for all types of car travel[71]), freight accounts for 17 Mtoe (trucks and light utility vehicles on roads 15 Mtoe; rail 1.4 Mtoe; waterways 0.4 Mtoe), air for 7 Mtoe (with 3/4 international flights including French overseas territories and 1/4 domestic flights).
The reference scenario would total 65 Mtoe in 2050.
D 5.2 Future: Sobriety and Efficiency
Compared to the present situation:
- technological progress should continue and become more general, with further reduced fuel consumption per km traveled and per tonne conveyed [72]. The fuel used per unit distance could decrease by 30% to 40% by 2050, with more emphasis on cars than on trucking.
- one can hope for a switch from cars to public transportation, modified behavior (ride-sharing, new city travel modes, ...) that could balance the population increase in terms of kilometers traveled.
- the transfer of freight transport from road to rail and waterways will be limited. Only a small fraction (about 30%) that covers medium sized distances (more than 500 km) could undergo a modal shift to rail or waterways. But beyond the difficulties relative to a necessary rail network extension, given that passenger rail transportation has priority, we place little hope in a large increase of the share of modal shift for freight; a shift to rail implies bulk breaking, making it less competitive.
- air transport demand for domestic flights could decrease by 50% but should not change much for overseas flights, if it does not increase (because of the population growth and a larger share of leisure travel).
On the other hand, while these theoretical gains would result in a 32 Mtoe demand, delays, systems inertia and the Jevons paradox (rebound effect) must be taken into account. Negatoe retains a 70% effective success rate, leading to a 35 Mtoe demand in 2050 based on the same share of fossil fuels as today. This is 29% less than today but 37% less per capita. The resulting energy management effort relative to 2015 is considerable (roughly -1%/yr). It is even more considerable relative to the reference scenario (almost a factor two).
D 5.3. Replacing Oil: Biofuels and Electricity
As discussed above, the demand can be cut back but the present allocation of resources has to be drastically revised, with a radical reduction of the share of oil if strong action on carbon dioxide is to be undertaken[73]. A revolution is necessary and the quasi total domination of oil abandoned, with a shift to biofuels and electricity provided the latter is carbon free. Clearly, though, this revolution will take place in a context where the efficiency improvement of combustion engines competes and is complementary with the shift.
Oil could be replaced with synthetic fuels produced from coal (CTL) or gas (GTL). In the absence of massive CO2 capture and storage[74], these options do not fundamentally change the picture vis-à- vis the greenhouse effect and reaching the factor 4 (it would be even worse with CTL).
D 5.3.1 Biofuels
A 2003 European directive had set a 5.75% (LHV) biofuels target in 2010 which translates, for France to 2.8 Mtoe. This is practically reached with 2.6 Mtoe in 2015, based on the present so-called first generation technology and standard European agriculture, with the processing of beets, wheat, rape ... But this production requires external energy input and, considering the energy (fossil so far) consumed to produce the biofuels, the real net value is much less and can be estimated to be 1.5 Mtoe. Proceeding much further seems problematic. Raw materials would have to be imported[75]; agricultural resources are limited and mobility would rapidly be competing with food supply. In net contribution, not including imports, the limit would lie between 3 and 5 Mtoe, far removed from the needs. Moreover, the net appraisal of greenhouse gas emissions is far from the one hoped for.
Fortunately, new potential production capacity is identified with lignocellulosic biomass (second generation biofuels), and production enhancement thanks to external energy input sources[76]. In self consumption with a close to 40% energy return, about 1.5 GJ energy has to be added to produce 1 GJ biofuel from 1 GJ biomass; this energy has to be carbon free, it can be either biomass (starting from 2.5 Mtoe biomass, 1 Mtoe biofuel could be produced and the self consumption covered) or it can be electricity, or again, a combination of the two, depending on the respective prices of biomass and electricity, and on biomass scarcity.
Note 1:
In theory, value can be added to the biomass with external hydrogen input. Indeed, the proportion of hydrogen relative to the carbon is smaller in the plant than in hydrocarbon. The plant composition is C6H9O4, i.e. a proportion of 3 hydrogen atoms for 2 carbon atoms; in hydrocarbon, the proportion is 2 hydrogen atoms for each carbon atom, or 4 hydrogen atoms for 2 carbon atoms. The plant's carbon can thus be put to better use with hydrogen feed in. The theoretical mass return can then reach 58% and, in practice, 40% to 50%. With 1 tonne raw material and hydrogen feed in, it would be possible to produce 0.4 tonne liquid biofuel with the same properties as today's fuels derived from oil. However hydrogen production takes energy so that altogether, the balance is not good, the global energy return is obviously poor (final energy return relative to factory entry 40% to 50%, primary energy return about 25%) and the investments larger (in addition to the biomass-to-liquid (BTL) investments, the hydrogen production investments). This approach could become attractive if biomass were to become very expensive. In that case, the process could be taken further with "hydrogen enrichment" (see Appendix 2, Electricity and Hydrogen).
Note 2:
Another possibility is to produce biogas fuels (biomethane) instead of liquid biofuels. The synthesis of methane from lignocellulosic biomass is achieved preferably via the thermodynamic process (see Appendix 3) used for liquid fuels. The return is better since the synthesis reaction is exothermic. However, when taking into account the necessary gas cleaning process to upgrade to methane, as well as the whole logistics to bring the gas to the filling station outlet, it is wise to retain a global return similar to that of liquid biofuel production (40% to 50%). The choice between liquid or gaseous fuels will then rest on usage convenience: liquid as a direct substitute for gasoline or diesel, or gas to power a fuel cell (FC for instance PEMFC). However, even if the hoped for technological progress is successful in developing an affordable methane fuel cell, pressurized methane will be required to provide an acceptable distance range.
Given these elements, in Negatoe for 2050, we retain 10 Mtoe liquid biofuels, measured as final energy (measurable by the user at the gas pump) produced from 17.5 Mtoe biomass and 7.5 Mtoe electricity (the necessary 15 Mtoe energy being provided equally by biomass self consumption and by electricity, here 87 TWh).
Note: 10 Mtoe biofuel could be produced with a different combination[77], for example: Biomass 7.2 Mtoe; Electricity 11.3 Mtoe; Gas 0.8 Mtoe.
Add to this 2 Mtoe methanation biogas (see Appendix 3), essentially for local transportation usage in agriculture and public utilities. Biogas can come to compete with liquid biofuels, but overall, both are based on the same limited amount of biomass.
D 5.3.2. Electricity
Besides biofuels, which will not be sufficient to come near the factor 4, a contribution from electricity is a possibility, provided it is not produced from fossil fuels. Electricity can be used directly, to power public transportation (trains, trams, subways,...) it can also extend to individual transportation, thanks to the development of batteries, for use in 100% electric vehicles or in rechargeable hybrids. Fully electric vehicles can cater to city or city and vicinity needs (typically the second car[78]). Rechargeable hybrid vehicles can do with smaller capacity batteries; with a 100 km range, for example, they should satisfy most of the daily journeys which do not cover more than 40 km on average, while consuming practically only electricity[79].
All told, with electric and hybrid vehicles, the equivalent of 15 Mtoe oil should be replaceable with 5 Mtoe electricity (58 TWh).
D 5.4. Transportation Recap
Starting from today's 49.2 Mtoe final energy consumption and counting on conservation amounting to 14 Mtoe (technology improvements, city organization, individual behavior) and, more than anything else, the leading role of electric transportation and its efficiency in terms of useful energy (3 times better than with combustion engines) we obtain 23 Mtoe final energy, a 53% gain relative to the 2015 situation and a 65% gain relative to the reference scenario.
This is achieved with the following distribution:
- electric public transportation 3 Mtoe[80] (35 TWh)
- electric or hybrid cars 5 Mtoe (replacing 15 Mtoe oil) (58 TWh*)
- liquid biofuels 10 Mtoe (produced from 17.5 Mtoe biomass
and 7.5 Mtoe electricity)
- biogas 2 Mtoe
- oil 5 Mtoe
Transportation is thoroughly disrupted, more so than any of the other sectors. This appears to be both feasible and reasonable, provided the transportation demand management efforts (technological progress, public transportation development, city planning,...) are successful. If only 9 Mtoe were saved instead of 14 Mtoe, the share of electricity would have to be increased by about 2 Mtoe (+23 TWh).
*Note: The 58 TWh correspond to battery charging.
As discussed in Appendix 1 (see the smart grid and demand spreading), the variations of the daily total power demand observed on the grid are on the order of 20 GW. The smooth distribution of charging hours(seeking mostly night hours, e.g. the car in the garage charging between 9 PM and 7 AM) should allow demand satisfaction without requiring additional installed power (obviously favorable for the nuclear load factor).[81]
D 6 Global Recap: Final Energy Demand
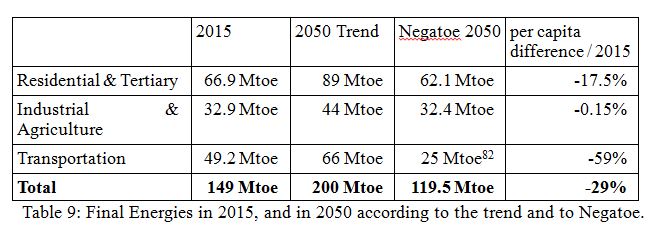
Table 9: Final Energies in 2015, and in 2050 according to the trend and to Negatoe.
E) Carbon Free Energy Sources from Now to 2050
Reducing the share of fossil fuels implies, barring drastic energy conservation, calling on carbon free energy sources: renewables[83] and nuclear power. Today, in France, renewables provide 25.1 Mtoe primary energy (9.4% of the total) and nuclear power provides 114 Mtoe (43%), while fossil fuels ensure 109.3 Mtoe (44%). Reducing these by a factor close to 4, i.e. an 82 Mtoe reduction, cannot be achieved solely by energy conservation which, as discussed above, could amount to 29.5 Mtoe final energy relative to 2015 (149.2 - 119.5). In first approximation, the 52.5 Mtoe discrepancy (82 - 29.5) has to be filled with carbon free sources whether they generate direct heat, or heat and electricity from a single source (cogeneration), or only direct electricity.
E 1. Renewable Direct Heat Sources
E 1.1. Biomass, Biogas, Carbonaceous Wastes
Consisting of wood fuel from forests, various agricultural and household wastes, first generation biofuels, the resource today amounts to 13.9 Mtoe primary energy[84].
- a) Wood Fuel
With wood fuel amounting to 9.5 Mtoe, the 2015 forest accounts for only 3.7% of the total primary energy production. Can this very small share become more significant, even if it cannot become the main factor? As a first observation, a certain fact, the forest is under-used. Annual plant growth represents 120 Mm3 to 130 Mm3; if we don’t count half of the residuals (the branch remains and trunks that are left on site because of their poor value as timber) we obtain about 110 Mm3, which is the theoretical amount available for use, as a first maximum estimation. Furthermore, without counting tree crowns or the other half of the remaining residuals (left on the ground after timber logging) and excluding mortality, the annual growth that could be directly exploitable is in reality 83 Mm3. Including direct waste from timber processing and wood industry as well as individual users' harvest, we arrive at an equivalent of 66 Mm3/yr, approximately 60% of the annual growth. This total is divided about equally (40%) between timber and firewood, the remaining 20% being transformed by the wood industry (paper pulp, ....). Since the lumber and wood industry generate wood waste directly, the total for wood fuel amounts to 9.5 Mtoe.
Approaching the 110 Mm3 limit, up to 15 to 17 Mtoe primary energy could be obtained, keeping in mind that forest exploitation will also increase its timber (more wood construction) and wood industry (paper pulp ...) output in the same proportions. Since there is no major technical obstacle, this should be achievable within a few decades. It implies, however, a full reorganization of the wood sector, including private property merging to facilitate mechanical logging, along with tax reform to encourage long term planning, etc[85].
However, this has to be placed in a global biomass and land use perspective, as discussed below.
Negatoe does not anticipate fundamental changes in land use (simple 15/10/15 allocation[86] ). In particular, Negatoe does not interfere with surfaces dedicated to food crops, does not consider drastic diet modifications[87], meets the additional needs due to population growth (+13%) and, more important, does not consider reducing the share of exported produce (11 billion €/year commercial surplus from agriculture and the food processing industry, that are essential to the trade balance). To compensate for the +1 Mha soil artificialization, and a 2 Mha extension of organic agriculture for organic produce, we consider a small (- 2 Mha) reduction of pasture (better efficiency) and of forest (-1 Mha), given the extension of forest surface in recent years (+0.4%/yr), mostly due to negligence and laissez-faire (very small properties).
Altogether, forest and underbrush could supply 15 Mtoe primary energy (with a small adaptation of forest management but not to the detriment of lumber).
- b) Biofuels
Biofuels emerge as the second potential contributor to the overall biomass and miscellaneous appraisal. Note, however, that with the so-called first generation process, the 2.6 Mtoe primary energy produced in 2015 generated only 1.3 Mtoe final energy.
It is only by shifting to new generation production processes that significant advances can be made in this domain. For Negatoe, the 2.2 Mha dedicated today to the production of first generation biofuels would switch to crops adapted to second generation processes, such as miscanthus, to produce 15 tonnes dry matter/ha or a total of 11 Mtoe/yr primary energy[88]; a multiplication by somewhat more than 4. In order to satisfy the 17.5 Mtoe primary energy demand (see § D 5.4) 1.3 Mha of forest (8.6%) would have to switch to intensive biofuel oriented production. The 15 Mtoe discussed above (wood fuel) would drop to 13.7 Mtoe and the total produced by both forest and biofuel oriented crops would amount to 30.7 Mtoe.
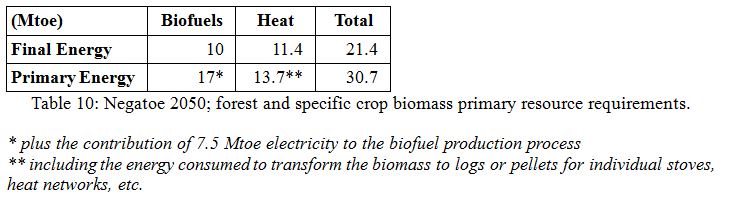
- c) Waste
Besides wood fuel discussed above, there are other types of wastes that can be of value as energy sources, via incineration[89] or methanation[90].
Today's less than 2 Mtoe total primary energy could increase to at least 5 Mtoe, totaling 4 Mtoe final energy, distributed as 2 Mtoe heat and 2 Mtoe biogas for transportation.
E 1.2. Miscellaneous Heat Renewables Other than Biomass
- Thermal solar could easily provide 3/4 of the domestic hot water for a large fraction of households and contribute, though modestly, to the heating of premises in privileged zones that enjoy good sunlight. It could contribute up to 4 Mtoe.
- A significant development of heat pump based surface geothermal[91] and aerothermal energy sources can be expected. These could be dominant in tertiary buildings and could spread to a large portion of individual housing. The contribution to final energy can be estimated at 9.8 Mtoe: 7 taken from the ground or the air and 2.8 contributed indirectly by the electric heat pumps COP: 3.5).
- Deep or semi-deep geothermal energy is not yet very widespread (0.2 Mtoe) but should expand to reach 1 Mtoe.
Overall, about 12 (4 + 7 + 1) Mtoe heat could be generated, not including biomass and wastes.
Including biomass, the total "heat" renewable primary energy production could amount to 47.7 Mtoe, i.e. a 30.3 Mtoe increase relative to 2015. The resulting final energy would amount to 36.4 Mtoe.
E 2: Direct Electricity Renewables
As a reminder, at the European level, France has committed to producing 23% of its energy from renewable sources by 2020. In order to keep this promise, measured in final energy units and including heat and electricity, the Grenelle de l'environnement has specifically projected an intensive deployment of direct electricity renewables with 19 GW onshore wind, 6 GW offshore wind and 5.4 GW photovoltaic by 2020.
The electric renewable production and installed power in 2015 were as follows:
Continental hydro power: 60.9 TWh (21 500 MW)[92]
Marine energy: 0.5 TWh (240 MW, one facility on the Rance river)
Wind: 21.3 TWh (10 400 MWi end of 2015)
Photovoltaic: 7.3 TWh (6 500 MWp installed end of 2015)
Various (wastes, wood fuel cogeneration ...) 5.3 TWh
Total: 95.3 TWh (17% of the total 568 TWh generated from all sources)
E 2.1 Hydropower
Today in France, hydropower is by far the largest renewable electricity source: 60.9 TWh[93] or 10.7% of the total 568 TWh domestic production. The same is true worldwide with 21% (5 100 TWh) hydropower for a total 24 000 TWh[94] electricity production. In contrast with the rest of the world, in France and in Europe, hydropower should not evolve much in the future. France is already well equipped and the available sites are limited (financial and technical limits, protected zones, local opposition). Local adaptations of existing continental hydropower sites could somewhat increase the amount of energy generated but the run of the river production will be limited because of increasing flows reserved for other uses. Beyond this, the principal unknown is marine energy. Given that the tidal barrage power industry will not be further developed[95], the only perspective in France rests on tidal stream turbine[96] power, whose tests are beginning.
All together, a 70 TWh[97] target in 2050 for all hydropower seems within reach.
Thanks to its flexibility, hydropower offers many advantages compared to other energy sources. It plays a major role in ensuring grid stability, being better able than other sources to meet the production and demand balance variations during the day. While electricity cannot be stored, or poorly so (see Appendix 1), water can be stored in altitude and it is in general easy, within the limits of materials wear, to adjust the water flow to the needs (excepting run of the river hydro). But it seems the flexibility limits of hydropower have been reached today, that it can practically not contribute more flexibility, e.g. to meet an extensive deployment of intermittent or heavily fluctuating sources[98] (see § E 2.2 and E 2.3).
Further development of PSH (Pumped Storage Hydroelectricity 4.4 GW today) is limited as well. A common mistake consists in believing that it is possible to convert an existing dam on a river to a PSH. This ignores the fact that what counts in a PSH is the size of the "lower" reservoir and that creating new ones will be expensive and complicated socially (acceptability). On the other hand, where existing lake dams form a cascade arrangement within a valley, there are some possibilities for PSH development[99]. Taking various constraints into account (outdoor activities in particular), 1GW or 2 GW additional PSH should be within reach. Another option, using the ocean as the "lower" reservoir, is being considered and evaluated but it remains very limited: the height difference between upper (on the cliff) and lower reservoir (the sea) would be rather small so that considerable volumes would have to be implemented for the upper reservoir[100].
E 2.2 Wind Power
Large scale wind power deployment in France is recent (240 MWi[101] in 2000, 1000MWi in 2005, 10 400 MWi at the end of 2015 - a significant 800 MWi increase within the year 2015). All these turbines are onshore. Offshore wind construction is beginning, after a number of incidents around calls for bids that were not selected. Several successive calls for bids have been necessary before the official acceptance of a first 3 000 MW group concerning 5 different sites. For these, the prices posted range from 200 €/MWh to 220 €/MWh[102]. Overall, including the indirect cost due to intermittence and the cost of the required electric connections, this amounts to nearly 5 times the production market price. This extra charge will have to be payed for during 20 years by the electricity consumers. Proceeding beyond 3000 MWi seems unbearable. This is why Negatoe does not follow the "Grenelle de l'environnement" hypothesis, namely 24 GW (19 GWi onshore and 5 GWi offshore wind) installed power by 2020.
Although the extra charge for onshore installations has decreased and is now stabilized, it remains unacceptable for offshore wind. This cost handicap is reinforced for both onshore and offshore wind if the extra charge for the required backup is included (see below, fluctuations, production variability). For onshore wind, residents' opposition has to be taken into account: noise and other pollution (in particular, in relation with the 500m proximity[103]), property devaluation ... and territory fragmentation.
Wind Power Variability: an Observation at the French and European Scale
The wind production variability is directly visible in Figure 6, which shows, as a significant example, the power generated in France in early 2012 by the whole 6500 MWi wind fleet.
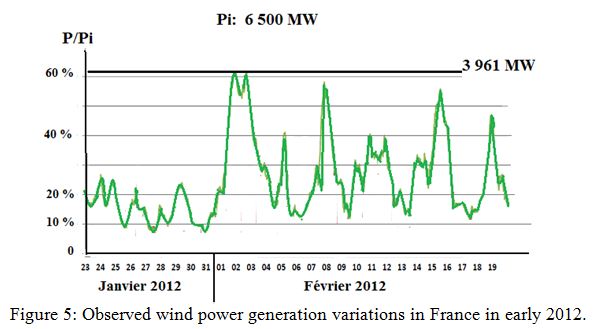
This production time frame was publicized by the SER (Syndicat des Energies Renouvelables - renewable energy syndicate), as a power generation and load factor record achieved during this exceptional production month. Indeed, this month is particularly propitious to wind; however, for a more extensive and complete perspective, the curve should be extended over several weeks before and after this particular period, and this, the SER does not do. Over the larger time scale, the power generated fluctuates between 5% and 20% of the installed capacity (Pi) as here, at the end of January. But this is hidden from the general public and the media so that political decision makers are generally at risk of being poorly informed.
In a wide range of operation, the power generated by a wind turbine varies, in theory, like the wind speed cubed: V3 [104] Wind speed is not particularly stable so that it is not surprising that the power generated by a single wind turbine fluctuates abruptly, shifting from its maximum to zero within a few hours. For example, if the wind speed changes, within a half hour, from 40 km/hr to 30 km/hr, the power generated is divided by 3. The claim is often voiced and printed that this effect is mitigated when considering a large territory, thanks to compensations (less wind in Northern France being counterbalanced by more wind in Southern France). Figure 5 shows that, if there is always, somewhere in France, a little wind, it can, in reality be close to zero globally and then, what a mess! Fluctuations and variations by a factor 2 within a few hours are common in the entire country. Certainly, weather forecast has improved so as to anticipate next day strong variations (today for tomorrow) but this changes nothing basically, short term forecast is still difficult. The fact remains that these variations and drops to almost zero have to be managed.
The development of offshore is put forward, arguing that it has a better load factor. This should translate into a lower cost to the MWh. But this does not hold because, while the load factor is improved, for example by 30%, the much larger investment cost than for onshore wind (see Appendix 4: 2.5 €/W instead of 1.5 €/W) is not counterbalanced. Moreover, offshore wind's advantage in reducing the intensity of fluctuations is not established: the instantaneous power fluctuations are all the more intense and rapid if the output can rise to levels closer to 100 % nominal power.
Possible solutions for the management of wind power variability.
There are four possible approaches (see also Appendix 1 on grid load following):
- Grid reinforcement, an essential step to be able to transport the very large instantaneous power[105]. This requirement has led to promoting interconnections at the European level; unfortunately, as shown in Figure 6, the fact is that when the wind blows in the North Sea it usually blows at about the same time all the way to Spain so that the benefit of interconnections is limited.
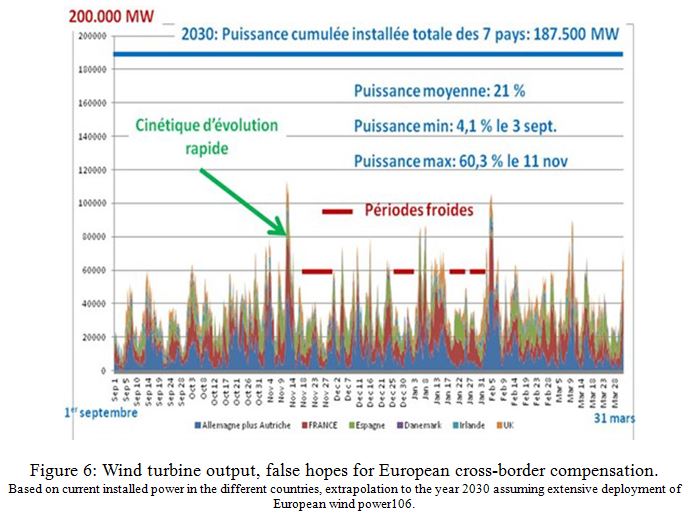
Based on current installed power in the different countries, extrapolation to the year 2030 assuming extensive deployment of European wind power[106].
- Electricity storage: there are ways, in particular PSH which has, until now, been used to balance demand variations. But the existing PSH installations are limited (4.4 GW) and quite insufficient, even in conjunction with reservoir hydro power; they are unable to satisfy the needs as soon as the installed wind power exceeds ten or so GW. Most of the other storage possibilities either have small capacities and are extremely expensive (batteries) or have poor energy efficiency (hydrogen in particular).
- Withdrawal of other production means, in France essentially mountain hydro and nuclear power, a paradoxical solution which withdraws carbon free production to make room for another carbon free production, with no CO2 emission reduction whatsoever.
- Turning on backup devices which are mostly based on gas combustion (or coal combustion as in Germany), thus increasing CO2 emissions.
How these are combined depends on many parameters among which the most important is the initial configuration of the country's electricity system. The situation in Germany[107], which has a very large fleet of fossil fueled power plants capable of withdrawing during production peaks and of producing during production dips, or in Norway, which has an adjustable hydro power fleet, is clearly not the same as in France which can, to a certain extent, adjust its nuclear power production (up to 10 to 15 GW[108]) and call on PSH (5 GW) and mountain hydro (also about 4 GW). The upper limit would be close to 25 GWi wind (for a large network, this would produce rapid power leaps on the order of 20 GW, not too different from the daily variations currently encountered - see Appendix 1).
The direct and the hidden costs of wind power.
The cost issues are the second major obstacle, all the more so for offshore wind. The costs for onshore wind, a strongly industrialized sector for many years, seem to have stabilized. Today's 82 €/MWh feed-in tariffs (over a 10 year span) should not decrease further or change except as a function of the cost of raw materials or of labor (maintenance costs). However, the indirect costs should be included also; the cost of nuclear power modulation[109]; the cost of backup systems on standby (extra investments, operating workforce always on call, not counting the extra fatigue on materials subjected to load variations[110]); the cost of network reinforcement (network transport capacity has to be increased by several tens of GW). These currently hidden costs are not easily evaluated, they should add some tens of €/MWh (40 to 50 €/MWh[111]) to the cost of onshore wind.
As for offshore wind, the sector has not yet reached maturity and the costs announced are very dissuasive, with values above 200 €/MWh[112] for 15 years, with a great deal of uncertainty on the maintenance cost (sea effect), plus the added backup cost, as with onshore wind.
Overall, this leads Negatoe to limit the share of wind power, and not develop it beyond the 18 GWi that are already installed or on waiting list or on order (the offshore 3 GW); this corresponds to a 45 TWh production potential.
Note: wind turbines and land occupation
15 GWi onshore wind turbines, i.e. about 6000 machines, would cover a 1250 km2 surface (0.125 Mha) or 0.23% of the mainland territory. If they were aligned to form two rows, the "aisle" if it were 1 km wide, would be 1250 km in length. However, only a limited fraction of this surface (concrete block and surroundings, maintenance access) would be neutralized (about 250 km2, 25 000 ha) unavailable for any other use, in particular for agricultural use (one thinks of energy crops on the 0.1 Mha available - see § E1).
Between now and 2050, the issue of the replacement of these installations when they reach their end of life (20 years, for example) will arise. The investments for their installation were done in favorable conditions with guaranteed purchase of their electricity, in a speculative context which will necessarily go away within a few years. In the absence of subsidy, these installations can only decrease at the 2050 horizon.
E 2.3 Photovoltaic
The development of solar photovoltaic doesn't begin until 2009 with 190 MWp installed compared to the 30 MWp of 2008; cumulative installed power increases to 2.5 GWp in 2012 and 6.5 GWp at the end of 2015 (a 0.6 GWp installed power increase during the last year). The 5.4 GWp target identified by the Grenelle de l'environnement was surpassed in 2014. Why such success? The deliberate development of the sector was based on the mandatory purchase by EDF of any PV production with feed-in tariffs 5 to 10 times above the electricity market price. For example, the tariffs at the time the Grenelle was launched were 600 €/MWh for installations integrated to buildings. Fortunately, this tariff was lowered (still 320 €/MWh in 2013) down to 235 €/MWh in 2017 for installations with a capacity between 0 and 9 kWp[113]. In the case of simplified integration to the building and up to 36 kWp, the feed-in tariff is 123.8 €/MWh and for a 36 to 100 kWp installation, it is 117.6 €/MWh. These tariffs hold for 20 years, i.e. beyond the 15 years guaranteed to wind.
For larger capacities, the call for bids procedure is the rule, resulting, for example, in 2011 for an 8 MWp installation, in a 300 €/MWh[114] accepted feed-in tariff. But with the decreasing cost of equipment imported from China, on a plot of land that belonged to the State and was sold for next to nothing, the feed-in tariff for the Cestas[115] 300 MWp installation is 105 €/MWh.
Clearly, the financial aspect was totally absent from the Grenelle, giving rise to aberrations such as the staggering feed-in tariffs for solar integrated to buildings, leading a number of private individuals to bank on the generosity of others, namely the EDF subscribers, via the CSPE[116]. The costs have decreased, can they continue to do so? Maybe, but the costs do not include the hidden cost of the backup or hypothetical storage needed to compensate for the absence of sun.
prices have decreased, can they drop further? Maybe but they don't include the hidden cost of backup to compensate for night hours, or of a hypothetical storage.
Note: these costs, which include neither the indirect cost of backup systems on standby (such as gas power plants) required to compensate for the variability (see Appendix 1 and 4) nor the grid extensions needed to cater to the dispersion of production, should be compared to the average electricity production cost in France, i.e. about 50 €/MWh (5 c€/kWh).
While its cost is, more than for wind, an obstacle, photovoltaic electricity suffers from the same impediment as wind, the variability of its power generation. Here, the qualifier intermittent applies without discussion, given the total absence of production during large intervals, in particular in the evening when the demand is at its highest. However, photovoltaic solar benefits from a better predictability than wind, although abrupt local variations are possible[117], notwithstanding a lesser winter production when the demand is larger (factor 4 to 5). A positive element should be noted: the production maximum occurs around noon and early afternoon, it coincides with the first daily demand peak. If it is well anticipated in the so-called day before grid management (see Appendix 1), this input can be interesting, and will not jeopardize the grid stability as long as it is relatively small (such is not the case with wind production) but at what cost this input!
Carried away by the Grenelle impetus, assuming that this sector aims essentially at sustaining exports, we retain a 10 GW maximum capacity for an 11 TWh production. The replacement of these installations at their end of life will come up before 2050, in particular the ones that are integrated to the buildings. They were launched in a speculative context, and with the end of subsidies, they will end up not being replaced.
Note: photovoltaic power and land occupation
Since most installations lie on existing surfaces (roofs, warehouses, ...) the issue of land occupation competing with agriculture concerns only the ground-mounted farms, like the Cestas 350 GWh example and its 2.6 km2. Assuming that this type of installation would represent 1/4 of total PV, about 20 km2 of dedicated land would be necessary, i.e. 12.5 times less than for wind.
One essential point that must be kept in mind in any forecast is that the electricity sector is, in 2015, accountable for only about 6% of France's carbon dioxide emissions. Any massive deployment of the intermittent renewables for electricity production will thus, given the necessary capacity of the essential flexible backup systems (gas turbines in particular) have a negative impact on greenhouse gas (GHG) emissions, while GHG mitigation should be the one and only priority.
E 2.4 Various wastes, wood, ...
Wood and carbonaceous wastes can contribute to some extent to the production of electricity, in particular with cogeneration (useful heat and electricity) in relation with waste incineration or methanation. This decentralized production could yield about 11 TWh electricity.
E 2.5 Overall Assessment of Electric Power Renewables
Altogether, the electric power renewables (Sum of § E 2.1 to E 2.4) could generate 137 TWh of which 56 TWh originate from the 28 GW intermittent renewables (iREL).
The instantaneous production of the 28 GW of iREL (56 TWh), because they are intermittent, will vary between 25 GW (maximum day's sunlight and windy day) and 0.9 GW (at nightfall, i.e. every 24 hours, and mild wind and this can last several days during anticyclonic periods). As the system must cope with practically no power generation from iRELs at certain times, and in the absence of particular storage capacity, except for PSH, already well exploited, these iRELs rely on others to meet the demand, so-called substitution. This induces a down scaling of the energy produced by the other sources but has practically no impact on their installed power, nor, then, on investments, nor on the operation costs (staff at work, regardless of the power generated). The only significant gain would be on fuel costs. Nuclear power being the main load following entity, this induces, essentially because of wind power intermittency, a 6% decrease of the nuclear load factor. The gain on fuel costs does not compensate, by far, the investments and operation costs associated to iRELs; moreover, no overall reduction of carbon dioxide emissions is obtained.
E 2.6 What Should We Make of Decentralized Energy Systems?
Complex energy systems see the light of day here and there, with a mix of intermittent electricity sources (onshore wind, solar PV), heat and electricity cogeneration associated to methanation facilities to produce storable biogas or to more or less modular incinerators, or to heat networks. In some favorable situations, these local systems can help avoid feeding intermittent electricity into the high power grid. On the side, they allow touting a certain degree of local energy autonomy. One of their assets, not to be shunned, is to enhance "good citizenship". But decentralized systems cannot meet concentrated energy demand (industry) nor can they incorporate centralized production (500 MW offshore wind farms). One can ask if they would see the light, were it not for the enormous subsidies allocated to intermittent renewable electricity sources and to cogeneration.
Recall that in the early days of electricity production, the facilities were decentralized (often to supply a factory). Networks were developed to avoid failures. Will decentralized consumers accept to do without electricity every once in a while?
E 3. Nuclear Power
In 2015, nuclear power production amounted to 437 TWh (77% of the total electricity produced in France) with 63 GW installed capacity. This output rests on 58 nuclear units that were brought into operation from 1977 to 2000 (from Fessenheim 1 with its industrial commissioning in 1977 to Civaux 2 and its industrial commissioning in 2000). While the initial lifespan was 40 years[118], (consistent with an expected 30 year financial return, and not because of technical limits, these allowing much longer operation), Negatoe builds on a lifespan extension allowing 50 to 60 year[119] operation, under the provision of unit by unit approval by the ASN (Autorité de Sûreté Nucléaire - French nuclear safety authority). No new technical problems arise from these extensions, given that today's reactors, so-called generation 2 reactors, have constantly undergone improvements (in particular during the ten-yearly shutdowns) and their safety has been progressively improved in order to comply with the latest standards, including post Fukushima upgrades. These improvements are executed under the supervision of the independent nuclear safety authority, ASN.
The 77% share of nuclear power in the generation of electricity is represented as justifying the "all nuclear" label. But the share of nuclear in the final energy consumption is in fact less than 19% (the electricity vector covering only 25% of the final energy needs with an installed capacity share below 50%). Should the share of nuclear be reduced to less than 19% to meet a supposed diversification goal, sometimes put forward: "avoid putting all one's eggs in one basket". Fine, if the other eggs in the basket were able to meet the demand as necessary but this is not the case for intermittent renewables, too dependent on weather conditions.
In Negatoe, the share of nuclear power will be the amount needed to achieve at least cost the carbon dioxide emissions division by 4; nuclear becomes the adjustment variable.
The total final energy demand being 119.5 Mtoe (see Table 9), if we subtract the 36.4 Mtoe renewable heat energy, we are left with 83.1 Mtoe. With the division by 4 of the contribution of fossil fuels, these should be reduced from 109.2 Mtoe (see Table 6) to 27.3 Mtoe, including electricity generation. For the latter, a first approach would consist in a scale down, also by a factor 4, transitioning from 40 TWh to 10 TWh. But to deal with iREL intermittency (wind and PV) without impacting the nuclear power load factor too heavily, the plan is to keep available a 20 GW gas-fueled capacity, for an annual 20 TWh energy production (1.7 Mtoe final energy). Excluding electricity, the final energy share of fossils would amount to 25.6 Mtoe. The remaining 57.5 Mtoe (83.1 - 25.6) final energy demand would be met with electricity. But to these 57.5 Mtoe, we have to add the 7.5 Mtoe of intermediate electricity consumption for the elaboration of biofuels, leading to a 65 Mtoe total (756 TWh) at the grid outlets, where the users are.
Tracing back to the production needs, we have to add the sector's self consumption[120] and the distribution losses (7% in 2015). We arrive at a production total of 845 TWh, with 137 TWh generated by renewables, 20 TWh generated by gas-fueled plants, leaving 688 TWh for nuclear power.
Nuclear production is thus scaled up by 57% (from 437 TWh to 688 TWh). New IIIrd generation units will replace today's units as they reach their end of life. Whatever the final capacity selected (simple replacement with unchanged capacity or capacity increase as discussed below) in order to avoid a "cliff" effect and resume a construction rate similar to that of the 1970s (more than 4 units per year in some years) the permanent shutdowns will have to be planned ahead assuming a lifetime between 50 and 60 years. The need for new replacement units then arises in 2027 and ends in 2060, spreading constructions over 33 years as shown in Figure 7. In 2050, 16 GW of IInd generation units would still be in operation. Negatoe considers that the 63 GWe capacity limit stipulated in the 2014 energy transition legislation should be exceeded and that IIIrd generation units, as shown in Figure 7, should be built beyond simple capacity replacement.
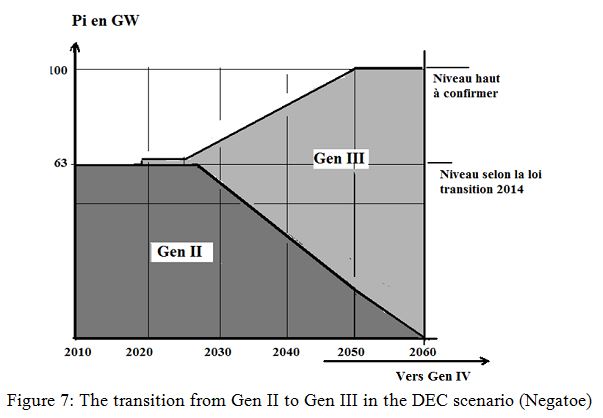
Figure 7: The transition from Gen II to Gen III in the DEC scenario (Negatoe)
The new 1650 MW EPR units would replace the current units (900 MW to 1450 MW) whose mean capacity is 1070 MW. The EPR is designed to produce up to 13 TWh per year but it is likely that some of them would be used for partial load following, thus limiting the number of gas fueled power plants for wind power backup and to meet the winter peak demand (see Appendix 1). With an 11 TWh/yr mean electricity yield (76% load factor) about 64 EPRs would be necessary (see final wind up § F3.2), a number not far removed from today's 58 units and a construction periodicity of 2 EPR/yr[121]. Note that the EPR is designed for a 60 year end of life. This does not preclude longer operation, similarly to the procedure currently underway to extend the operation of today's units from 40 to 50 and/or 60 years, as always, under provision of the ASN's approval.
These new IIIrd generation reactors rely, like today's units, on enriched uranium supplies[122]. Much like what happened with the demand for fossil fuels, after depletion of the most easily accessible (here uranium) deposits and depending on the development of nuclear power in the world, the market could be disturbed by a price increase of the resource but this will not happen before the end of the century[123]. The deployment of IVth generation breeding reactors, then, is not an issue in the frame of Negatoe 2050. The design and development of a prototype unit, going on to an industrial scale demonstration plant belongs to a different sphere. In any case, such development will not impact significantly the overall Negatoe 2050 perspective.
F) Final Negatoe Wind Up
F 1. The Objective: Minimal Cost
The amounts of money at stake in the replacement of about 90 Mtoe/yr (three fourths of 120 to reach the factor 4) fossil fuels (mostly oil and gas) are considerable. The Negatoe scenario advocates the least expensive options while keeping in mind previous commitments agreed to by France, in particular at the European scale, regarding carbon dioxide emissions reductions.
In the stationary energy consumption sector, the scenario excludes extreme energy conservation solutions which are very expensive in older housing and advocates intermediate solutions which combine low cost energy conservation actions done in conjunction with regular maintenance ("diffuse renovation") with intelligent electricity use (heat pumps and direct electric heating that switches off during peak hours - peak shaving). In the new residential building sector, the scenario rests on architectural designs with reasonably small energy demand, here again without inducing large extra costs, and a combination of electricity and renewable energies. A similar pragmatic approach is expected in the other sectors (industrial and tertiary) where the situations vary widely. In all these sectors, the technology is available. A criterion such as the cost of saving a unit toe should exclude solutions that are too costly. This could be worded as: any fossil energy conservation action that would be economically profitable for a 1400 €/toe energy price is an action that is not too expensive. Of course, the less expensive actions would be the first to be chosen.
In the transportation sector, the distinction must be made between consumption management, the development of biofuels and direct electricity use.
- Technological progress for engines and the development of public transportation should reduce consumption progressively. But it seems essential to go beyond that and it will require changes in individual behavior, this being related to urban organization. An economic criterion probably does not make much sense in this area which impacts many different fields other than energy (town and country planning, urban organization, health and pollution management, ...).
- Second generation biofuels produced from lignocellulosic biomass combined with carbon free energy feed-in will replace the first generation biofuels. This is dependent on research programs designed to develop economically viable processes at the industrial scale. The cost of such biofuels is commonly estimated at 1300 €/toe to 1400€/toe[124], or 1100€/Mm3. This is expensive but less so than hyper insulation of older residential buildings and there aren't that many other options to replace oil use in transportation.
- Direct electricity mobility compatible with city needs could be deployed rapidly thanks to batteries ensuring a 100 km to 150 km range. The development of electric vehicles for general use is still up against the battery issue for ranges of 300 km to 500 km. This leaves plenty of room for rechargeable hybrid vehicles, with battery ranges on the order of 50 km. The price of electricity does not play a significant role here; however, the extra cost due to the battery investment (between 5000 € and 10 000 €) would place the cost of the oil toe avoided around 1500 €. Note that the deployment of electrical vehicles depends on the availability of charging outlets whether individual or collective. The role of public administrations and local authorities is essential here, and they should put forward solutions that minimize public spending.
The direct use of hydrogen in vehicles equipped with on board fuel cells is not selected in Negatoe, because of the cost and also because of the difficulty in deploying the appropriate logistics (see Appendix 2). Hydrogen could, however, find a niche in particular situations (company fleet, for example).
F 2. A Gradual Approach to Achieve the Factor 4
Regarding stationary energy usages, the difficulties in globally implementing the actions required will come from the logistics and the large time constants in particular where residence and living habits are concerned. But there does not seem to be an obstacle to progressive action at a rate that will depend on the average cost of energy, on the amount of public aid and on successful mobilization of the profession. Incentives should preferentially push the most rewarding CO2 efficiency investments so as to reach an economically and socially sustainable progression and generate new potential for progress. The Negatoe scenario retains an adaptation period up to 2020 and then a steady annual rate for all stationary uses (for example, between 2020 and 2050 an annual rate of 400 000 new residences built, along with 400 000 older building renovations), these being within reach financially provided super performance excesses are not sought that would lead, for example, to more than 10 years return on investment.
Concerning mobility, regarding both demand mitigation and the replacement of oil by biofuels and electricity, Negatoe retains slow build up from now to 2020. Given, on one hand, the very large time constants relative to the development of public transportation and, on the other hand, the need for technico-economical advances in vehicle consumption, biofuels and batteries, the scenario retains a faster rate between 2020 and 2050 in order to reach the target.
As for electricity production, there is no uncertainty regarding the technical and financial feasibility of the nuclear deployment considered. The planning must take into consideration the life time of today's units, a balanced industrial development rate and acceptance by the public. Concerning wind, its cost is still a limiting factor, especially that of offshore wind, but the main problem is its insertion in the electrical grid which is then confronted with quasi unmanageable fluctuations. Solar PV remains uncertain. Although it is truly intermittent, its integration in the grid is somewhat less difficult than that of wind, because it is more predictable and is not totally out of phase with demand (if there is phase agreement to a certain extent at the beginning of the day, it is totally out of phase at the end of the day). But the main obstacle is its cost, particularly when integrated in the construction. In spite of the cost scale down due to worldwide industrialization, its cost, especially if the intermittency related indirect cost is included, stays out of the ballpark of electricity prices, except for particular local uses (isolated locations). Any intensive deployment of wind or solar PV would require the simultaneous development of large scale storage for electricity but no financially or technically sustainable solution is in sight. The costs incurred because of intermittency have to be included in the evaluation of these energy sources.
Today's policy granting priority access to the grid and above market price feed-in tariffs to production entities that just feed electricity onto the grid as it is produced, with no flexibility, should be replaced with an obligation for these production units to deliver guaranteed production (incorporated backup) or, alternatively, with an obligation to pay a tax earmarked for hydro and nuclear power (the opposite of the current CSPE).
This, in conjunction with a cessation of subsidies and feed-in tariffs should limit the future deployment of these sources in mainland France, except for particular situations such as isolated locations or islands.
F 3. Main Results of the Negatoe Wind Up.
F 3.1. Final Energy
The final energy consumption decreases from 149.2 Mtoe in 2015 to 119.5 Mtoe in 2050, (a -20% variation relative to 2015 and -29% per capita scale down) according to Negatoe while the trend would have been an increase to 200 Mtoe.
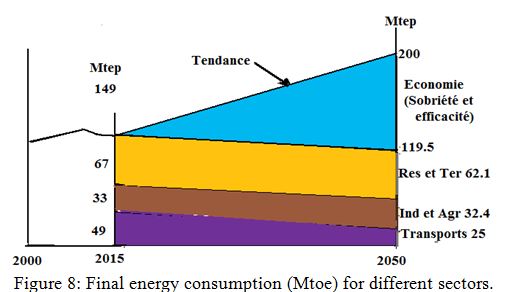
The break up for different consumption sectors and energy sources is given in Table 11 and in Figures 9 and 10.
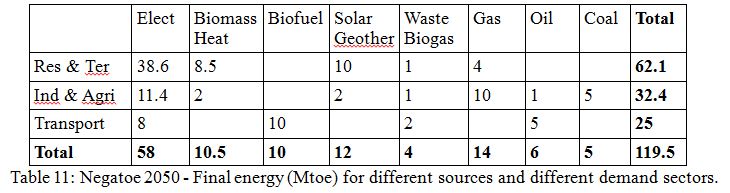
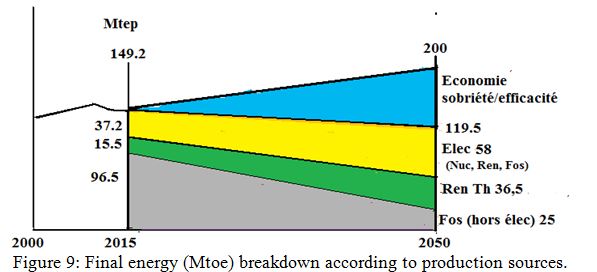
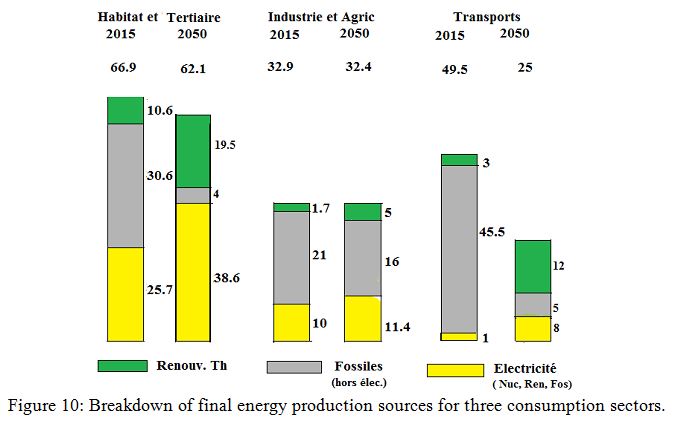
Figure 10: Breakdown of final energy production sources for three consumption sectors.
F 3.2. Electricity
In order to meet the final electricity demand as well as the intermediate electricity consumed in biofuel production, the Negatoe electricity generation in 2050 is 845 TWh, 49% more than in 2015. This is somewhat more than in the reference scenario (755 TWh) and may seem contradictory since energy conservation is put forward. Taking several factors in consideration, this positive 90 TWh gap can be accounted for:
- A large electricity demand increase in stationary uses (heat and specific electricity use) combined with renewable energies in the residential and tertiary sectors and with new processes in heavily CO2 emitting industries.
- Intensive electricity use in transportation as a direct replacement for oil (electrically powered public transportation, electrically powered vehicles, rechargeable hybrid vehicles).
- Biofuel production with a process that makes the best possible use of the biomass resource.
This evolution is a direct consequence of the factor 4 goal, electricity being, along with energy conservation and renewable energies, particularly for heat production, the third means available to mitigate fossil fuel needs.
In order to avoid contributing heavily to CO2 emissions, the electricity must be produced with carbon free sources (nuclear power of renewable energies), or with decarbonized sources (fossil fuels with CO2 capture and storage (CCS)).
- Today, about 80% of the electricity in France is produced from nuclear power, ensuring essential energy independence and a favorable economic environment. It would be advantageous to keep this proportion, provided public acceptance continues. The annual carbon dioxide emissions would be increased by 450 Mt if the electricity were produced with coal-fired power plants, and by 210 Mt if it were produced with gas-fired combined-cycle power plants.
- Coal-fired power plants with CCS is one of the solutions considered in the MIES report[125] on the factor 4. But one must be aware that CO2 capture and storage removes only about 3/4 of the CO2 emitted[126]. In other words, even if this solution becomes feasible at the industrial scale and receives public acceptance, the production of 45 Mtoe to 50 Mtoe electricity with coal and CCS would result in doubling, or more, the CO2 emissions from the electricity sector in 2050. As a consequence, CCS is not retained in Negatoe.
F 3.2.1.Negatoe Partitioning of Electricity Production
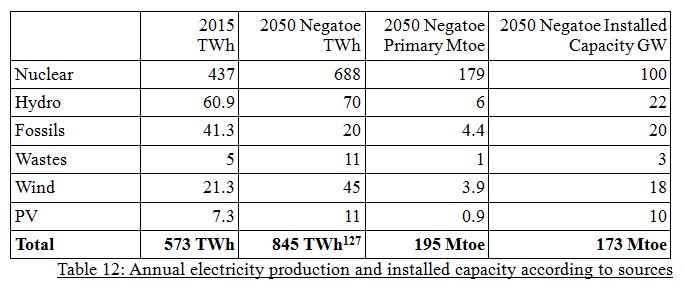
F 3.2.2. Electricity and Varying Capacity Needs
In the Negatoe scenario, electricity consumption increases by 75%, from 436 TWh in 2015 to 762 TWh in 2050 (including the intermediate consumption of the biofuel production process). If, as we have seen, the overall annual energy production/consumption balance evens out, what is the situation at different times in the year? Moreover, the overall analysis cannot consist only in balancing the amounts of energy produced and consumed. The capacity must also be appraised, not the average capacity, but the instantaneous capacity because electricity cannot be stored at the scale needed. We discuss this issue in Appendix 1.
In short, the large electricity consumption increase considered in Negatoe, in particular for heating and transportation, combined with the arrival of new intermittent (or fluctuating) electricity generation sources, are compatible with grid management continuity provided the iREL installed capacity is limited to 28 GW, i.e. 12% of the total installed capacity. This, however, requires an extension of the power variability provided by nuclear power[128] and implies a specific role for gas-fueled power which will have to follow wind power fluctuations closely and also meet the temporary winter demand peaks.
F 3.3: Supply, Primary Energy Resources, 2015-2050 Transition
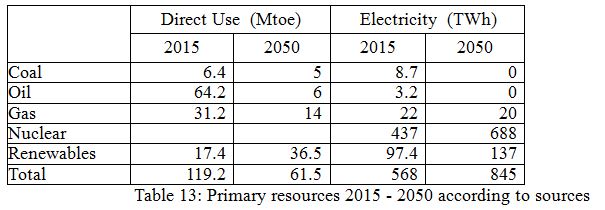
The 79.9 Mtoe scale down of fossil resources (109.3-29.4; division by 3.7) is compensated by a 19.1 Mtoe scale up of heat renewables and wastes (multiplication by 2.1) and by a 290.6 TWh increase of carbon free electricity (multiplication by 1.55) with +251 TWh nuclear power (multiplication by 1.57) and +39.6 TWh renewable (multiplication by 1.4).
F 3.4: Fossil Fuels and Carbon Dioxide Emissions
Fossil fuel consumption according to the different sectors and the corresponding CO2 assessment are shown in Table 14.
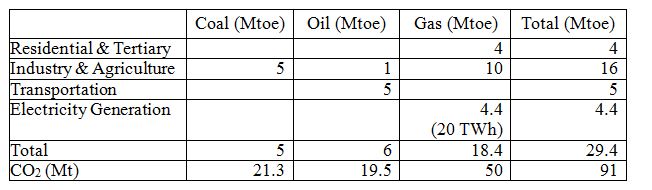
Table 14: Negatoe 2050: Fossil energies in Mtoe and CO2 emissions in Mt for different sectors.
The Negatoe wind up shows a division of CO2 emissions by 3.8 compared to year 2015 and by 4.4 compared to year 1990[129].
G) The Financial Aspects: the Cost of the Energy Transition
Carbon dioxide emissions reduction in the Negatoe scenario is based on:
- energy conservation: sobriety and efficiency
- a significant increase of the contribution of alternate carbon free energies to replace in large part the reliance on fossil fuels.
- heat producing renewables
- electricity from nuclear power and, to a lesser extent, from renewables
- biofuels for mobility
The mention of energy conservation immediately evokes less spending, in particular in fossil fuel purchases and the reduction of our annual bill which amounted to 51.6 G€ in 2015[130].
Energy conservation can in many instances, however, cost a great deal, with investments that must be payed back and a return on investment that may never happen. Similarly, calling on energy sources whose fuel equivalent is free[131], such as the wind and the sun, is not systematically advantageous economically; here again, investments that are often considerable have to be repaid (production device, electricity transport, load following backup); load factors are small, and maintenance must be included (in particular for marine installations).
Including these expenses, whether newly incurred or avoided, the study[132], whose main hypotheses are detailed in Appendix 4, takes a first simplified economical approach to the Negatoe scenario as compared to:
- status quo: no changes, same overall and per item per capita production, leading to a global 13% increase, to match the population growth.
- following the trend, i.e. business as usual (BAU).
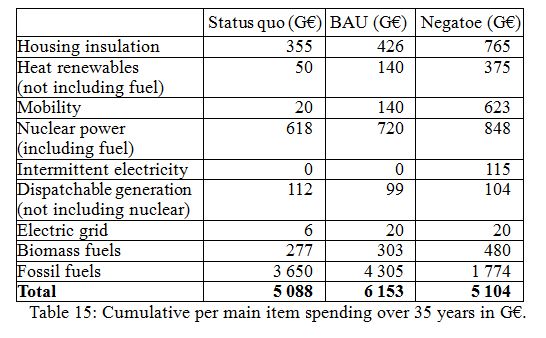
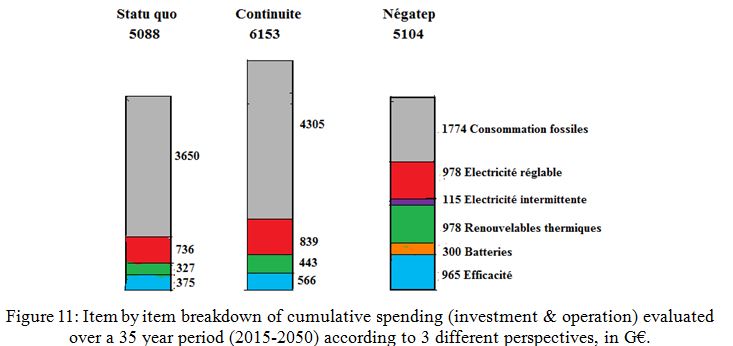
Overall, the 35 year cumulative expenses (2015 to 2050) in the Negatoe scenario are, within about 0.3%, of the same order of magnitude as the expenses implied if the energy situation of today were kept strictly unchanged except for an adjustment to the 13% population growth and with no introduction of a carbon tax. The annual average total expense is 145.4 G€ for the status quo and 145.8 G€ for Negatoe to meet the factor 4 goal, an insignificant financial difference.
The additional spending devoted to improving energy efficiency, in particular for housing insulation, and to replacing oil with biofuels and electricity turns out to be compensated by a reduced fossil fuel purchase invoice[133]. A carbon tax wouldn't even be necessary to achieve the factor 4.
For practically identical spending, this translates into a carbon dioxide emissions division by 3.8 by 2050. This represents, over the 35 year transition period (2015 to 2050) 4427 million tonnes carbon dioxide that are not emitted, i.e. an average 126.5 million tonnes per year. With a carbon tax amounting for example to 50 €/tonne CO2, the tiny 0.3 G€/year cost difference would change signs and increase to 6 G€/year.
Compared to the trend following BAU hypothesis, the Negatoe cost is lower by 1052 G€, i.e. 30 G€/year, in the absence of any carbon tax. With a 50 €/tonne CO2 tax the mean annual difference would be 39.7 G€/year.
H) Discussion
Negatoe is a scenario, it is not a prediction. It does rest, however, on a number of hypotheses that seem reasonable a priori, though they may not be verified, whether in the economic, the societal or the technological domains.
Economically, the sums at stake are considerable: the replacement of 90 Mtoe/year of oil and gas, CO2 emitters, with energy conservation and carbon free energies. Assuming a 1000 €/toe[134] average price over the period 2015 to 2050 for these energies (including the CO2 price), by 2050 90 G€/year must have been successfully transferred from the oil and gas industries to the new industrial sectors. Conceivably, the greatest uncertainty resides on the aptitude of our society to handle such a transition. All the more so that France is not alone and the steps that have to be taken have to fit into the European and world context. As this may be, it is essential that the less expensive solutions be selected at all times. A rejection of the development of electricity use, as expressed by the Grenelle de l'environnement, is contrary to economic logic and would entail an extra cost to the community whose order of magnitude for housing can be evaluated at 10 000 € for each additional toe/year avoided, i.e. 100 G€ to reduce fossil fuel use by 10 Mtoe.
The societal domain carries major uncertainties: how can the electorate be persuaded to accept a carbon tax today to better anticipate future fossil fuel price hikes? How can they be persuaded to invest in consumption reductions, to modify their habits? How can they be persuaded that the risks associated to nuclear power are well controlled and are smaller (all research work demonstrates the fact) than the risks associated to the generation of the same amount of electricity with coal, oil or gas? The advantages of nuclear power are far above its disadvantages, including when compared to fossil energies.
The technological domain, too, carries uncertainties: will batteries allow the development of mobility? Will the processes to synthesize liquid or gas biofuels be affordable? Will offshore wind and solar PV become major sources of electricity? Will the development of more efficient and cheaper electricity storage be successful? This is the sine qua non condition for a successful deployment of intermittent energies. Most of these questions justify considerable R&D efforts in France and at the European scale, as models to follow among developed countries. However, the factor 4 can be achieved with existing technology for most of the stationary energy uses and for the production of electricity.
In a Nutshell
Today, fossil fuel consumption to satisfy primary energy needs is close to 120 Mtoe. It would easily reach 160 Mtoe in 2050 if current errors were to be continued, with CO2 emissions following the trend.
The division by about 4 of these CO2 emissions relative to the present and by more than 4 relative to 1990, implies:
- Practically eradicating oil and gas in the residential and tertiary sectors. This is feasible with a combination of better insulation, heat renewable energies, and electricity. The main obstacle is financial.
- Strongly reducing the contribution of oil in transportation. A dual revolution is required: revisiting mobility (public transportation, freight) and replacing oil with electricity, both directly and via biofuels.
- Seriously limiting the use of fossil fuels in industry. This implies process modifications in particular (and as a consequence, massive investments).
- Avoid increasing the already small share of fossil energies in electricity generation, including gas. This implies two conditions: limiting peak demand, and putting an upper limit to the share of intermittent electricity sources (as long as electricity storage solutions remain unavailable).
Globally, this translates into four major developments:
- An overall 20% reduction of the demand (-29% per capita reduction) relative to the present, while following the trend would lead to a 33% increase, i.e. a 50% per capita increase.
- A division by about 4 of fossil fuel use.
- A strong scale up, a multiplication by a factor 3, of heat renewable energies,including biomass related energies.
- A significant increase of carbon free electricity generation (+55%) in both its aspects: renewables (+45%) and nuclear (+57%).
The progression of electricity generating renewables is limited: indeed, concerning hydropower, the principal electrical renewable today, practically all has already been done on land and the new renewables (wind, sun) stumble over their variability.
So we find a more than 50 % increase of nuclear electricity. But as a lot of uncertainties remain about the limitation of uses, and the possibilities of renewables, we consider nuclear power as an adjustment term that may vary above or below this value.
Observations show that any massively renewable scenario will require considerable investments, in particular in the electricity sector, with an installed capacity that is necessarily three to four times larger than peak demand, and with no notable benefit for the reduction of our country's CO2 emissions.
Acronyms
ADEME: Agence de l'Environnement et de la Maîtrise de l'Energie - French Environment & Energy Management Agency
ASN: Autorité de Sûreté Nucléaire - French nuclear safety authority
BAU: Business as usual - an unchanging state of affairs
BTL: Biomass To Liquid
CAPEX: Capital expenditures - the annual cost of an investment in the course of its depreciation
CCGT: Combine Cycle Gas Turbine
CCS: Carbon Capture and Storage
Cepmax: Consommation maximale d'énergie primaire pour le logement- Maximum primary energy consumption for a dwelling
COP: Performance coefficient of a heat pump
COPxx: Conference of the Parties or United Nations Climate Change Conference
CREDOC: Centre de recherche pour l'étude et l'observation des conditions de vie - Research Institute for the Study and Monitoring of Living Standards
CSPE: Contribution au Service Public de l'Electricité -contribution to the electricity public service a tax whose main component is now the financing of feed-in tariffs for electric renewables.
CTL: Coal To Liquid - conversion of coal to a liquid fuel
DGEC: Direction générale de l'Energie et du Climat- General Energy and Climate board, reports to the ecology administration.
DGEMP: Direction générale de l'Energie et des Matières premières, now DGEC
DNTE: Débat National sur la Transition Energétique - National Debate on the Energy Transition
EDF: Electricité de France, the historic national French utility
EPR: European Pressurized Reactor - IIIrd generation nuclear power reactor
EU: European Union
FC: Fuel Cell
GDP: Gross Domestic Product
GJ: Billion Joules - Unit of energy and its multiples (kJ, MJ, GJ, EJ)
Gpkm: Billion passenger-kilometers
Gtkm: Billion freight tonne-kilometer
GTL: Gas To Liquid - conversion of natural gas or other gaseous hydrocarbon to gasoline or diesel fuel
GW: Billion Watts - unit of power and its multiples (kW, MW, GW, TW)
GWi: Installed capacity and its multiples
GWh: Billion Watt.hours - Unit of energy and its multiples (kWh, MWh, TWh) 1 MWh = 3.6 MJ or 0.086 toe
GWhe: electric energy and its multiples
iREL: Intermittent Renewable Electricity source
LHV: Lower Heating Value - applies to fuels
LPG: Liquid Petroleum Gas
Mha: Million herctares
NRC: US Nuclear Regulatory Commission
OPECST: Office parlementaire d'évaluation des choix scientifiques et technologiques parliamentary commission for the evaluation of scientific and technological choices
OPEX: Operating expenditures - annual cost of operation
PEMFC: Proton Exchange Membrane Fuel Cell
Pi: Installed capacity
PSH: Pumped Storage Hydroelectricity
PV: photovoltaic electricity
RT: Thermal regulation in the French legislation, e.g. RT2012
SER: Syndicat des énergies renouvelables - French Renewable energy syndicate
tC: Tonne of carbon and its multiples (MC, GC)
tCO2: Tonne of carbon dioxide and its multiples (MtCO2, GtCO2) 1 tCO2 = 44/12 tC = 3.65 tC
Toe: Ton of oil equivalent and its multiples (Mtoe, Gtoe) (1 toe = 41.86 GJ)
Wp: photovoltaic peak capacity and its multiples (kWp, MWp, GWp)
References
- Chiffres clés de l’énergie, Édition 2015 du Commissariat au développement durable
- Scénario de référence SR2008 » de la DGEMP
- ADEME Chiffres clés du bâtiment, édition 2013
- Orselli – Rapport n° 004834-01 au Conseil Général des Ponts et Chaussées « Les économies et substitutions d’énergie dans les bâtiments » (février 2008)
-.P. Bacher – « L’interdiction des lampes basse consommation : une fausse bonne idée » - TechnAgora (23 juillet 2009)
- B. Jarry «Rapport du groupe de travail sur les biocarburants » (2008) de l’Académie des technologies.
- « Vecteurs d’énergie » - rapport de l’Académie des technologies (novembre 2011)
- « Les énergies renouvelables, Etat des lieux et perspectives » par C. Acket et Jacques Vaillant ; Editions Technip 2016 (2011 actualisée et enrichie)
- P. Mathis – « La biomasse, filière d’avenir ? Editions Quae 2013)
- Le Nucléaire et la Planète, 10 clés pour comprendre » - F. Sorin (édition Grancher – 2009)
- « Road map 2050 : a practical guide to a prosperous, low carbon Europe – European Climate Foundation – www.roadmap2050.eu
-“ Electricité : intermittence et foisonnement des énergies renouvelables” H. Flocard, Jean-Pierre Pervès, Jean-Paul Hulot (Techniques de l’Ingénieur - 10 octobre 2014)
- www.hprevot.fr - « Effet de serre, indépendance énergétique – facteur 3 en 30 ans »
- http://www.ufe-electricite.fr/IMG/pdf/ufe_etude_1_.pdf
- « Le Nucléaire et la Planète, 10 clés pour comprendre » - F. Sorin (édition Grancher – 2009)
- Mission Interministérielle de l’Effet de Serre, La division par 4 des émissions de CO2 d’ici 2050 (2004)
Appendix 1: Electricity and Grid Balance
In the Negatoe scenario, the final electricity consumption is practically doubled, from 436 TWh in 2015 to 722 TWh in 2050, a large increase. To meet this global demand, the 845 TWh gross production is ventilated as follows:
- Nuclear power 688 TWh (437 TWh in 2015 x 1.57)
- Renewables 137 TWh (94.5 in 2015 x 1.45)
- Fossils (gas in 2050) 20 TWh (41.3 in 2015 / 2)
The global annual energy balance evens out in theory, with balanced exports & imports over the year[135]. But what of the situation at different times of the year, of the day? The global energy analysis must be completed with a capacity analysis, not in terms of average capacity, but in terms of instantaneous capacity, because large scale electricity storage is not available. The grid balance issue is not new, it is, obviously, mastered today. If all the demand and production data evolved similarly, e.g. if they were multiplied by 1.65, the question would not be posed in new terms, we would just have a homothetic transformation of all the capacity curves versus time with no significant change. But this is not the case, because neither hydroelectric power nor fossils can increase significantly; hydroelectric power for lack of large new installations; fossils to avoid increasing carbon dioxide emissions which, though already small, should decrease a somewhat further[136].
Add to these limits a strongly disruptive element: the increasingly substantial presence of new renewable electricity sources (iREL) that are intermittent (solar) or variable (wind).
In this new context, after a review of the current variation of electricity demand, we examine, in the Negatoe 2050 frame, the management of so-called seasonal differences (winter/summer) in relation to the role of electricity in domestic and tertiary heating, and continue with the management of iREL variations.
Present Situation: Electricity Demand Variability
Electricity demand varies constantly. The large seasonal variations must be distinguished from the daily variations. Seasonal variations extend over several months and can be evaluated on a monthly or, better, a weekly basis, as shown in Figure App1.1
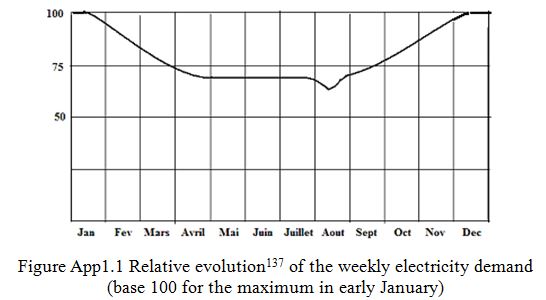
Figure App1.1 Relative evolution[137] of the weekly electricity demand
(base 100 for the maximum in early January)
Starting from a 100 index in early January, the weekly demand declines progressively to 70 in May, to rise again to 70 in September and to 100 in December. Note the little dip in August that corresponds to the maximum of the large summer pause, industry included.
The daily variations are, in relative terms, roughly of the same order of magnitude around the average, but they are very rapid, with variation speeds close to 10%/hour, as shown in Figure App1.2 for two days: an average day in the heart of winter and a mid-season day without heating needs.
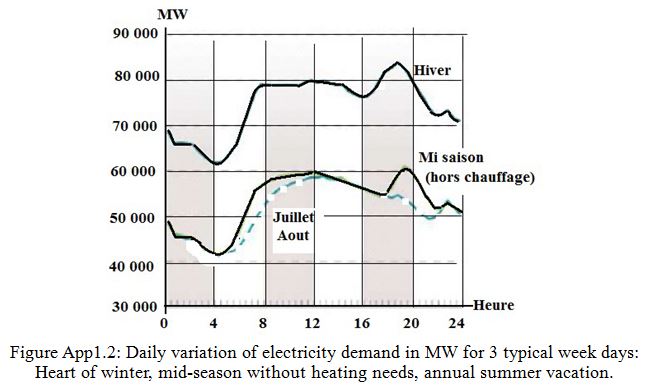
Figure App1.2: Daily variation of electricity demand in MW for 3 typical week days:
Heart of winter, mid-season without heating needs, annual summer vacation.
On week days, starting from a demand dip around 4:00 AM, the power increases by 16 000 MW between 5:00 AM and 8:00 AM to 9:00 AM (a variation that is somewhat larger in winter than in summer but not much). After a small decline in the afternoon, a second maximum is reached around 6:00 PM to 7:00 PM, the so-called demand peak. This peak manifests the general return home of families (lights on in all rooms, meal preparation, audiovisual media including flat screens turned on, video games,...). This peak occurs also in mid-season without heating, it is somewhat dampened (a very small heat related difference for the peak relative to demand during the rest of the day). It disappears completely in the summer when the daily routine changes radically because of school summer vacation and because family life continues later in the evening. Note a small peak around 10:30 PM, due to the automatic connection of hot water tanks programmed to run during night (off peak) hours.
The winter/summer demand difference observed on the weekly demand curve (Figure App1.1) is visible here too (Figure App1.2). The daily demand curves are almost a copy of one another, with a roughly 20 000 MW translation, this demand difference being the same in the dips, the peaks, and the average.
A calculation based on the global assessment of annual electric heating demand, that amounts to 80 TWh (45 for domestic + 35 for tertiary heating), and on the analysis of the curve representing average demand versus months, finds this same 20 000 MW value (Figure App1.3).
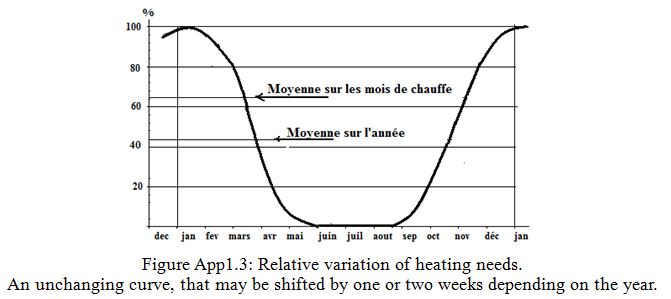
This 20 000MW maximum can be overshot and come close to 30 000 MW during a few tens of hours in the year, during very cold episodes[138].
Fortunately, however, these demand variations are pretty well foreseeable, specially 24 hours in advance (day ahead anticipation). The uncertainties on demand estimations are on the order of 2%. The production of the various electrical utilities can thus be planned. These will adjust, including with some degree of automation, their output capacity according to the program and thus ensure the demand versus production balance.
To match the demand in 2015, the installed capacity in France is 128 GW, with nuclear: 63 GW; hydroelectric power: 25 GW (including PSH); fossil-fired power: 21.8 GW; wind: 10 GW; solar photovoltaic: 6.5 GW; biomass 2 GW. Among these, hydro power ensures most of the daily capacity modulation (variable from day to day, on average around 5 GW, but possibly up to 10 GW). Of the other sources, nuclear and fossil fuels, along with the import/export balance, participate in this daily modulation to a lesser degree, each for about 4 GW on average. Wind and PV do not contribute to this output capacity adjustment, on the contrary, they disrupt it with real output capacities that can vary between 14 GW (in the middle of the day with bright sunlight and strong wind) and 0.5 GW (at the end of the day, with no sun and little wind, just when the demand is at its highest). The transition from one extreme to the other, i.e. 13.5 GW, can take place within a few hours.
Notes:
- a) Nuclear power load variations imply essentially night and week-end load reduction as well as temporary shutdowns (for example cold shutdowns) on week-ends and public holidays. This translates into the measured value of the operating factor, Ku. At present, a 0.94 mean Ku reflects situations where the output capacity is voluntarily reduced because of reduced demand on the grid.
- b) The real nuclear power production takes into account a '"load factor", Kp. This is the product of Ku, mentioned above, and Kd, the "Unit Capacity Factor" (UCF). The UCF is impacted by reactor shutdowns due to incidents or to programmed fuel loading procedures or maintenance work.
- c) Nuclear power management favors, in theory, unit shutdowns outside of the winter season. This leads to planning only one or two unit shutdowns in the winter (excluding exceptional work or ten-yearly inspections) and up to thirteen or fourteen in the summer (while giving seaside units running priority in the summer). This 12 unit management difference on a total of 58 units corresponds to a 20% capacity variation, i.e. 12 600 MW, covering partly the about 20 000 MW heating demand. The difference is obtained with the fossil fueled plants which are, at present, also used all year round (thus not entirely dedicated to electric heating) and hydroelectricity, excluding PSH (since these deal essentially with daily variations), hence reservoir hydro (9 300 MW) and pondage hydro (4 300 MW).
Negatoe 2050: seasonality and electric heating
The total electricity consumption in residential and tertiary buildings is 38.6 Mtoe (450 TWh). Removing about 295 TWh for electricity uses other than heating (specific electricity, domestic hot water, cooking) 155 TWh remain for heating, a little less than twice as much (x 1.94) as in 2015. Today's 20 GW seasonal difference could reach 40 GW. This summer-winter difference could be met thanks to:
- 3 GW from biomass and waste. Recall that their 11 TWh annual production is needed only during the winter months.
- 20 GW from gas-fueled plants. These would be operated all year round to meet the rapid variations of wind and photovoltaic.
- about 17 GW from nuclear power. These 17 GW, represent 17% of the 100 000 MW installed capacity. The management of routine temporary unit shutdowns should secure half of the 17 GW, the rest of these being obtained via partial load following[139].
- Mountain hydro can come as a complement.
Negatoe 2050, meeting iREL variations in daily demand handling
The rise of new renewable production systems (iREL) whose output to the grid cannot be adjusted to the demand (so-called spillage functioning), their output being, moreover, quite variable and random, will intensify the need for modulation by the other electricity producers, if blackouts or excess production are to be avoided. In situations where these iRELs do not cater to additional capacity needs but help reduce, at least temporarily, the amount of fossil fuels consumed (a situation typical of Germany but not of France), aside from the extra cost, their impact is beneficial: carbon dioxide emissions are mitigated. On the contrary, if the issue consists in meeting additional demand, dispatchable production means must be made available along with the new iREL capacity. This usually implies an investment in gas-fueled plants, leading to increased carbon dioxide emissions.
This result is antithetical to the Negatoe goal, wherefore the necessary examination of this issue, since France, a country whose electricity production is already almost carbon free, does not need this additional production from iRELs to reduce its carbon dioxide emissions.
Negatoe limits wind energy generation at 45 TWh and solar PV at 11 TWh, i.e. an iREL total production a little under 7% of the 845 TWh annual electricity production in 2050. As measured in terms of energy produced, this proportion seems to weigh little and it could lead to the conclusion that the situation is not significantly modified and is manageable. In fact, the capacity aspect is the one that counts and it must be examined: with 28 GW installed iREL capacity, they represent 16% of the total installed capacity all sources included, and their management is not straightforward; the limit is almost reached.
- The solar PV 11 TWh correspond to a 10 GWp installed capacity). Because of the geographic scattering, the real production should never rise to the peak power at any given time and the maximum instantaneous output capacity should be around 9 GW. The daily upward or downward 9 GW variations, (the fastest with a 6000 MW/hour[140] speed) will spread over 1.5 hour in winter and 4 hours in summer. They are more or less predictable. With a production peak in the middle of the day, the contribution of solar PV is out of sync by 2 to 3 hours each morning[141]. However, a 5 GW to 6 GW hydroelectricity production adjustment should allow to do without electricity storage. The 10 GWp would represent the upper threshold that allows to do without electricity storage besides the already planned hydro power and PSH. Pushing PV beyond 10 GWp would imply relying on battery storage to match daily variations without calling on nuclear load adjustments or on gas-fueled plants.
- The wind 45 TWh would be obtained from 18 GW installed capacity. Given the geographic scattering as well as the allocation of offshore versus onshore turbines, we consider the instantaneous power generated could vary between 16 GW and 0.9 GW. It would never drop to zero, as opposed to PV[142], but not much would be left. Here too the variations can be very rapid (a factor 2 within 6 to 10 hours, both upward and downward) as shown in Figure App1.4. The variations could reach 2 GW/hour, less than PV, but also less predictable.
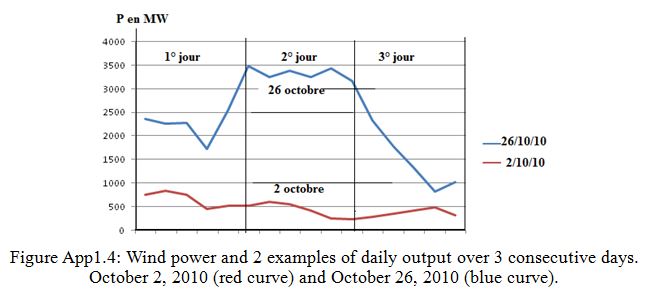
Figure App1.4: Wind power and 2 examples of daily output over 3 consecutive days.
October 2, 2010 (red curve) and October 26, 2010 (blue curve).
Forecasting the instantaneous wind capacity a day ahead at better than a factor two at a given time of day is difficult, yet it would be useful in order to plan the contribution of other energy sources. Flexible, fast response production facilities, then, have to be available to meet these fluctuations. The wind related grid unbalance should in large part be compensated by nuclear power which, while its installed capacity is kept at the same level to be able to take on the highest demand values in situations of feeble to quasi non-existent wind, would find its energy production reduced by 45 TWh, reducing its load factor by 6.5%.
Both iRELs together can thus cause 25 GW variations in the daily production. The other carbon free dispatchable production means (specially hydro, and nuclear to some extent) that are already called upon intensively to meet the daily demand variations (on the order of 20 GW), have to extend their flexibility range. In addition to extending the nuclear flexibility range, another 20 GW gas-fueled units, distributed between combustion turbines and CCGTs[143] have to be installed.
Proceeding further with more wind and PV than the 28 GW of iREL total installed power would imply (barring an equivalent increase of gas-fired plants with more carbon dioxide emissions, and that is excluded) the deployment of large scale storage means, other than hydro which is already used to the full in Negatoe and, from nuclear, more modulation, further jeopardizing its load factor which is already reduced by 6.5%, and thus increasing the cost (by + 4€/MWh according to estimation).
A distinction must be made between:
- Daily storage such as batteries that could be associated to the photovoltaic equipment and would be adapted to small local installations (but would be expensive and would likely not be able to avoid a connection to the grid and the associated investment).
- Weekly storage associated to wind power.
- Monthly storage covering several months, to take the seasonal effect into account, mixing summer solar PV and wind all year round. This seasonal effect includes the difference in the demand discussed above (Figure App1.1) and the iREL seasonal variation, which is out of sync with the demand with a 3 to 5 factor between summer and winter for solar PV and rather indifferent for wind since on average, a notable wind maximum occurs only in March and April, not in winter when the demand is at its highest[144].
All the storage solutions imply energy losses because of the overall energy efficiency (conversion, storage). The efficiency is in the 65% to 75% range for PSH, about 55% for compressed air[145], in the 70% to 80% range for batteries and from 30% to 40% for hydrogen[146].
At large scale, neither of these storage solutions can be retained.
Note another possibility, by voluntary limitation of iREL production
The instantaneous capacity variations and the ensuing disruption from iREL production could be dampened, however, by voluntarily withdrawing part of the production, in an ON/OFF mode, when the grid nears saturation, thus avoiding a power outage cascade. A simple solution would consist in trimming wind production, leading to less "sellable" production and an income loss that would impact wind alone. For example, for Negatoe and the 18 GWi wind capacity, a trimming around 11 GW would lead to a production loss equivalent to only one or two days' production per month, or about 10%, by far preferable to demanding of nuclear or gas-fueled plants that they ensure the continuity of supply, or than investments in methanation (electrolysers, carbon dioxide retrieval).
Demand management, smoothing consumption, "smart grid"
In order to smooth the demand and thus limit the installed capacity needs, Negatoe puts forth electric hot water tanks[147] and vehicle battery charging during night hours, when the demand decreases. This, in conjunction with consumption management extending beyond the simple off-peak tariff reductions, should allow a better demand spread during the day. A complementary approach should, in particular, allow to shave off the "famous" evening peak. This has already been tested successfully by promoting remote appliance shutoff in connection with Linky type meters[148]. The heating demand during the evening peak should disappear; add to this postponed triggering for a few washing machines without jeopardizing wellbeing. Then, quasi plateau at the end of the morning and early afternoon would determine the maximum installed capacity needs[149].
Appendix 2: Electricity and Hydrogen
Like electricity, hydrogen is an energy vector and, contrary to electricity, hydrogen storage is not too difficult, though not devoid of specific explosion risks. Hydrogen is thus often presented as an energy for the future. There are several ways to produce hydrogen. The most commonly used are methane reforming[150] and water electrolysis. The climate change issue requires that greenhouse gas emissions to the atmosphere be limited as much as possible, in particular CO2 emissions, so that the only process that is really available on a large scale while limiting any increase to the greenhouse effect is water electrolysis, provided the electricity is generated by renewables, nuclear or fossils in conjunction with CCS[151].
Stored hydrogen, once it has been produced via water electrolysis, can be used as final energy directly in gas-fueled combustion engines, or to produce electricity in fuel cells, but also as a "raw material" in the synthesis of methane and (or) the production of liquid fuels. These various options imply (sometimes multiple) energy transformations which always prove detrimental in terms of energy efficiency, and cost. This is detailed in the document "Electricité et hydrogène" (Electricity and Hydrogen) by P. Bacher -
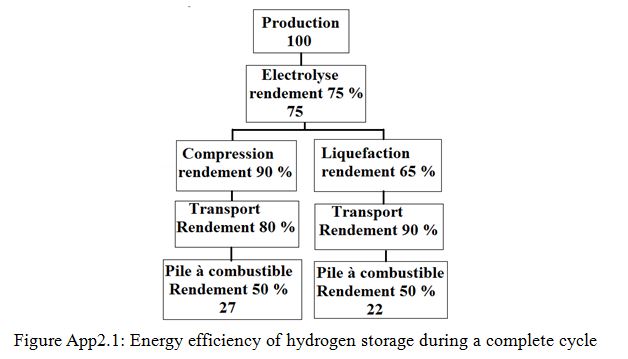
This document examines the possibilities for hydrogen to compete with other energy vectors, both for stationary energy uses and for mobility. After detailing the different modes available for hydrogen use (methane synthesis, mixing hydrogen into the methane transported by natural gas networks, feeding hydrogen into fuel cells to power electric cars, using hydrogen as a complement in the synthesis of biofuels) the document analyses the main cost components. The study shows that hydrogen is an expensive and inefficient way of storing electricity (even with a wager on significant progress in electrolyser performance). The study also shows that, faced with the competition of other heat production solutions, it is unlikely that hydrogen will be used in stationary energy applications; finally, it shows that, in certain conditions, hydrogen could contribute to the substitution of petroleum for vehicle propulsion[152].
This fully justifies not retaining the option of managing wind variability (large fluctuations) and the real intermittency of photovoltaic via electricity storage in the form of hydrogen or methane. The potential is quite small (in Mtoe terms) and the cost considerable of producing hydrogen to absorb the production peaks of electricity generation from wind turbines so that the solution presents little value, at least for centralized hydrogen production. The issue should be examined further in the event that inexpensive small capacity electrolysers become available. They could be operated in a decentralized way, in particular in local electricity networks, thus avoiding VHV network surcharge (or in the case of isolated networks[153]).
The large operational fixed costs severely jeopardize the use of electrolysers only during the peak production hours of intermittent electricity generators such as wind or photovoltaic. Keep in mind, however, that with nuclear, taking advantage of the 5 000 MW to 6 000 MW demand dip (May to October, nights, week-ends), it should be possible to produce 2 Mtoe to 3 Mtoe hydrogen at a cost in the range 1000€/toe to 1500€/toe while, with dedicated wind, the cost would range from 1500€/toe to 3000€/toe, and with wind peak hours only, it would range from 3000€/toe to 5000€/toe.
Even with a 1000€/kW[154] investment cost, leading to an annual fixed cost (CapEx + OpEx) of about 70€/kW, a 2000 hour/year use would lead to a 35€/MWh (nearly 400€/toe) fixed cost that would come as an add on to the cost of electricity.
Appendix 3: Methane Production Modes
While the combustion of methane emits slightly less carbon dioxide than oil (-17%) and coal (-36%) for a given amount of heat energy produced, still it is a carbonaceous fossil fuel that should be avoided, wherefore efforts to pull it out of the carbon assessment. Methane can be synthesized from carbon free energies in three ways:
- From hydrogen and CO2.
- With a process between pyrolysis and combustion to produce syngas comprised mainly of carbon monoxide (CO) and hydrogen (H2).
- Via natural biological breakdown of organic matter in the absence of oxygen (methanation).
App3.1 H2/CO2 Synthesis
The synthesis rests on the Sabatier process:
CO2 + 4H2 → CH4 + 2H2O + Q (exothermic reaction)
4 m3 hydrogen are needed to produce 1 m3 methane, or in other words, 1.2 toe hydrogen will produce 1 toe methane. Given the various losses, the energy efficiency of methanation can be estimated at 70%. But the energy consumed to purify the methane must also be taken into account, along with the necessity to have CO2 on hand. With a hydrogen cost that is as least 1000 €/toe to 1500 €/toe (produced with nuclear powered electrolysis) the CH4 could cost at least 1500 €/toe to 2000 €/toe, much more than natural gas (400 €/toe to 600 €/toe). With such a cost, the use of synthetic methane as a source of heat is practically excluded. Its possible use as a gaseous biofuel depends on the development of methane powered fuel cells at an affordable price[155].
Taking into account the electricity production efficiency (33%), the electrolysis efficiency (at best 60% for continuous operation), the various losses, the energy consumed to purify the methane and to capture the CO2, the whole operation has a final energy/primary energy ratio neighboring 10%.
Where the CO2 comes from is an issue in itself. If it comes from "fossil" CO2 capture from thermal plants or cement plants, the methane produced can hardly be considered "renewable". When it is consumed, it releases to the atmosphere CO2 which should normally have been stored. It must, then come from the combustion of biomass.
App3.2: Thermodynamic Biomass Processing
Thermodynamic biomass processing consists in a high temperature processing to breakdown the lignin molecules and arrive at a gas mixture called "syngas" (H2, methane, CO, CO2) in which the amounts of hydrogen and carbon are about equal[156].
In a second phase the syngas is transformed into methane, via complex reactions that are similar to those involved in methanation. Since these reactions are exothermic, the overall efficiency for the production of methane is relatively large (nearing 80%) but the resulting biogas contains all sorts of impurities and large amounts of CO2. The CO2 has to be separated out and the gas has to be purified, requiring complex energy consuming operations, to obtain methane that conforms to the transport and utilization standards. Moreover, the methane has to be compressed to 80 bars for use in transportation. The overall efficiency should be close to 50% but, similarly to the synthesis of liquid biofuels with which it will be competing for mobility applications, numerous studies will still have to be completed to optimize the process. Biofuels have a large potential since, with 20 Mtoe lignocellulosic biomass, it should be possible to produce 10 Mtoe gaseous biofuel.
Hydrogen obtained from electrolysis can, similarly to the preceding process and to the synthesis of liquid biofuels, improve the process. The CO2 separated during the last step of the process can be used as a non fossil CO2 source for the synthesis of H2/CO2. Synergies between the two processes, then, are possible[157] but whether all this has any economic value seems uncertain.
App3.3: Anaerobic Methanation of Carbonaceous Wastes
Carbonaceous wastes (from households, agriculture, the food-processing industry, etc.) represent a significant energy potential[158] but, because of their diversity, managing them and exploiting their potential is complicated; all the more so because of the competition between recycling, composting, incineration, and methanation via anaerobic fermentation.
We note that the choice between incineration and methanation depends on the type of waste (dry wastes are better adapted to incineration and humid wastes to methanation); as an order of magnitude, we can consider that half of the "primary" energy potential is liable to be exploited, half via incineration in cogeneration units, half via methanation.
Methanation installations are generally small (individual farm scale) and can retrieve carbonaceous wastes in their close vicinity (typically ten kilometers). The energy efficiency of methanation is around 50%[159]; the potential 4 Mtoe primary energy will yield 2 Mtoe methane. The methane thus produced contains impurities that would have to be eliminated if the gas were to be injected in the natural gas network, or used in modern vehicle engines. That is why the gas is commonly burned on site to produce electricity and, if the need exists, heat. A portion could, however, be used as a fuel for agricultural equipment.
The 4 Mtoe of potential primary energy from wastes treated via methanation could thus yield via decentralized production, about 1 Mtoe biomethane fuel for agricultural equipment, 0.3 Mtoe electricity, and 0.7 Mtoe heat. The 4 Mtoe of potential primary energy from incinerated wastes would yield, given a 20% self consumption, about 0.7 Mtoe electricity and 1.4 Mtoe heat.
The overall yield, in final energy, of the management of carbonaceous wastes would then be: 1 Mtoe gaseous biofuels, 1 Mtoe electricity and 2 Mtoe heat.
Note: Regarding methanation, Germany is often put forward as an example: more than 8000 installations "at the farm", very heavily subsidized, producing 7 Mtoe methane. To obtain such results, the "farmers" grow corn on 650 000 hectares and mix the corn crop with the wastes (in particular liquid manure from intensive livestock farming). Such management raises two serious issues: that of intensive livestock farming and that of the potential conflict between energy and human nutrition. Concerning the latter, the question is all the more legitimate when first generation liquid biofuel production is under strong criticism and will probably be phased out precisely because of this energy/nutrition conflict.
Appendix 4: Principal Economic Evaluation Hypotheses
- a) For electricity generation,
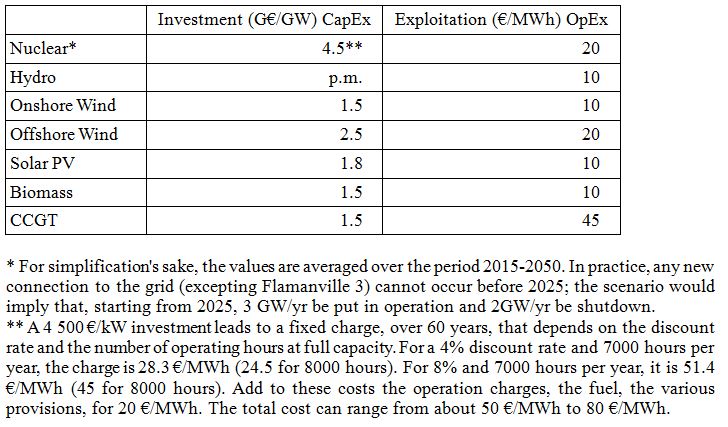
- b) Other data
- Insulation renovation in residential buildings: to upgrade to the RT 2005 type standard (on average, 100 kWh/m2.yr and not to the RT2012 standard): 15 000 € per dwelling.
- Regular heat maintenance, excluding insulation improvement: 5000€ per dwelling.
- Heat pumps: average investment cost: 12 000€ per unit.
- Biomass heating: investment cost to change heating mode: 10 000€/dwelling
- Solar heating, mainly solar hot water: 600€/m2.
- Biofuels: investment: 525€/toe produced.
- Batteries for electric cars: 5 000€ to 10 000€.
- Biomass matter: 550€/toe.
Appendix 5: An Economic Comparison at the European Scale
A basis for the financial comparison of various scenarios bearing on electricity only is provided in the document "Practical Guide to a Prosperous Low Carbon Europe" by the European Climate Foundation[160]. This study at the European scale aims, as Negatoe does at the scale of France, at dividing CO2 emissions by 4 by 2050. The objectives are similar, just as the observation that, to reach them, all the large CO2 emitting sectors have to be taken on. The two scenario families studied (Europe and France) call extensively on better energy efficiency, on heat renewable energies (biomass, solar heat, etc.) and on the replacement of fossil fuels by electricity in stationary uses (housing and tertiary) and in mobility (transportation). The shift from fossil to electricity implies a 50% to 100% electricity demand increase by 2050 (in France, the Negatoe production increases from 568 TWh to 845 TWh, i.e. +49%).
The two families differ, however, in the electricity generation means.
- ECF plans on massive reliance on renewable energies (wind and solar essentially) complemented by fossil based energies with CO2 capture (CCS) and nuclear power. It observes that the intermittency of these renewable sources entails the creation of a hyper electric grid that connects the South of Europe to the North and the deployment of a large capacity of combustion turbines as backup.
- The Negatoe scenario doesn't contemplate CCS and relies on a very large contribution from basic carbon free sources: nuclear power and renewables, the latter being stemmed because of their variability and the electricity storage issue.
The ECF study compares various scenarios to produce 5000 TWh electricity (in EU 27 + Norway + Switzerland).
- a) Baseline : 58% fossil without CCS, 24% renewable, 18% nuclear.
- b) 39% renewable, 30% fossil with CCS, 30% nuclear, 1% fossil without CCS.
- c) 58% renewable, 20% fossil with CCS, 20% nuclear, 1% fossil without CCS.
- d) 78% renewable, 10 % fossil with CCS, 10% nuclear, 2% fossil without CCS.
- e) 73% nuclear, 19% renewable, 7% fossil with CCS 1% fossil without CCS.
- f) 49% fossil with CCS, 30% nuclear, 20% renewable, 1% fossil without CCS.
The cost results are shown in Figure App5.1.
- Increasing the share of renewable, in order to reduce the carbon dioxide emissions, and jointly reduce the share of nuclear results in a total cost increase, up to 3500 G€ in changing from 24% (baseline) to 78% (upper limit of renewable share).
- Conversely, increasing the share of nuclear (from 18% in baseline to 73%) does not induce any extra cost as compared to baseline, while leading to an even greater reduction of carbon dioxide emissions.
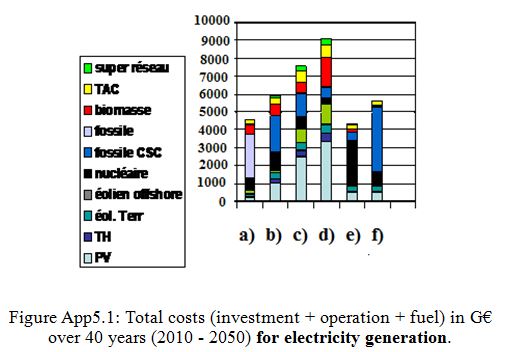
Figure App5.1: Total costs (investment + operation + fuel) in G€
over 40 years (2010 - 2050) for electricity generation.
The annual carbon dioxide emissions of these scenarios are 1280 Mt/yr in baseline; 314 Mt/yr in b); 266 Mt/yr in c); 273 Mt/yr in d) (division by 4.7 relative to baseline); 106 Mt/yr in e) (division by 12 relative to baseline); and 452 in f) (division by 2.8 relative to baseline).
How is Negatoe placed relative to these scenarios?
As shown in Table App5.1, Negatoe is close to the scenario labeled e), by far the least costly with a total cost 5% under that of the baseline reference. The economic evaluation of the Negatoe scenario discussed in § G reaches the same conclusion qualitatively, even though the domains covered by Negatoe reach beyond electricity alone. An emissions reduction policy, oriented towards the factor 4 can prove less expensive than laissez-faire. Nevertheless, any approach that leans towards predominance for renewables and a significant reduction of the share of nuclear power leads to financial discomfiture.
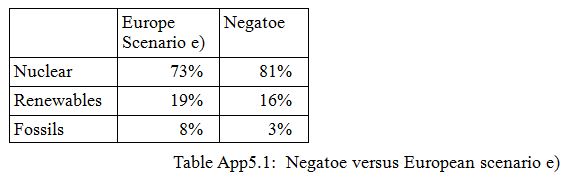
The study also shows that electricity transport between the North and the South of Europe, in the presence of large amounts of iREL and the establishment of a single electricity market, would require the deployment of a super VHV network, a large fraction of which would be transporting direct current, and would be underground. As shown in Figure App5.2, this super network would use France as the privileged crossroads of these VHV lines and this would certainly pose acceptability problems for lines whose usefulness for the French electricity system is doubtful to say the least. The financing of this super VHV network is problematic also.
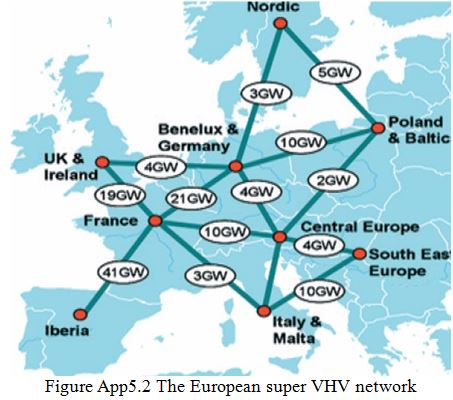
Figure App5.2 The European super VHV network
This study confirms that scenarios such as Negatoe that imply a large contribution of nuclear power require investments that are practically half those of scenarios with a large iREL contribution; this reflects in the total cost of electricity.
In other words, the study shows that a European energy policy executed along the lines recommended by ECF would lead to very heavy investments and, in constant Euros, to a doubling of the price of electricity in Europe by 2050.
And France would serve as the transit plate for European electricity, crisscrossed with numerous high voltage lines.
Appendix 6: Negatoe Variation: Towards Less Nuclear Power
To achieve the factor 4 and fossil phase out, Negatoe emphasizes, among carbon free energies, nuclear power which represents 81% of the electricity generation, with 58% of the installed capacity. This is far beyond the 50% put forward by the energy transition law. Although it is neither necessary, nor useful to the reduction of carbon dioxide emissions, the suggestion is often made that renewable electricity generation which, in Negatoe, produces 6.6% of the total, should take a larger part in the production of electricity.
While remaining in the general contours of Negatoe, with energy conservation representing at least 20% on the total final energy consumed (- 29% per capita), with a large scaling up of heat renewable sources (multiplied by 2.9), a large fraction of the nuclear power production would have to be shifted to electricity generating renewables. Hydroelectricity having practically reached its limits, only one option remains to reduce the share of nuclear: increase the share of the other renewable electricity sources, iRELs (wind and photovolaic) which, in Negatoe, generate 56 TWh, or 6.6% of the electricity produced, from 28 GW, or 16% of the installed capacity, all sources included.
Because iRELs are variable, the instantaneous capacity they generate can drop to practically zero, during many hours, if not days. This means that with an increased share of iREL production, the installed nuclear capacity has to be kept at 100 GW in the absence of electricity storage at the scale required, and at low enough cost. This translates into a reduction of the real capacity produced by nuclear power at certain times, and thus a further reduction of the load factor (already reduced by 8% with 56 TWh). This is called substitution (less nuclear production for more iREL production) , to be opposed to storage of iREL surplus production.
If we set a nuclear power variability limit at 50 GW we can aim at doubling the iREL capacity retained by Negatoe, increasing the total iREL installed capacity from 28 GW to 56 GW. This leads to Table App6.1 below, to be compared to Table 12 (§ F3.2.1)
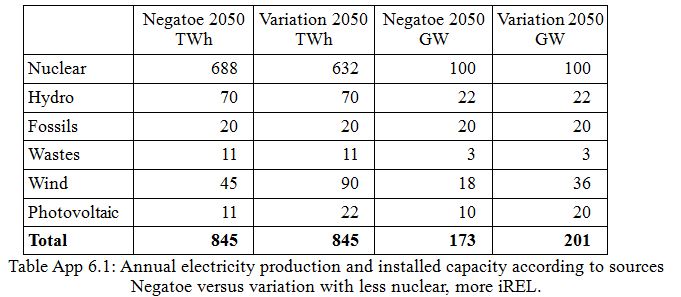
Table App 6.1: Annual electricity production and installed capacity according to sources
Negatoe versus variation with less nuclear, more iREL.
The impact discussed in § E2.5 on the nuclear load factor, this being the main load following entity and on the additional global costs, is more pronounced. The nuclear load factor will be degraded by another 8%. Based on the economic study[161], which evaluates, in particular, the cost of nuclear withdrawal during peak iREL production at 38€/MWh, the extra cost incurred with the variation would be at least 2.1 G€ (not counting the necessary grid extensions). Any other solution based on storage (batteries, hydrogen...) rather than substitution (adaptation of an existing method) would be, if at all feasible at a large enough scale, more expensive, even ruinous in the case of hydrogen. Remains the option put forward by some: drastically reduce consumption thanks to restrictions, at the limit of misery and dearth, ("la décroissance heureuse" (happy degrowth) as touted in some of the scenarios presented at the DNTE.
For example the Negawatt scenario, placed in the SOB category, anticipates a final energy consumption amounting to 69 Mtoe in 2050, i.e. a 54% scaling down of the total, or 59% scaling down per capita. The 462 TWh total electricity production relies for 85% (394 TWh) on iREL generation with no nuclear power at all.
As for the ADEME scenario[162], placed in the EFF category, it anticipates a final energy consumption amounting to 82 Mtoe in 2050, i.e. a 45% scaling down of the total, or 51% scaling down per capita. The 475 TWh total electricity production relies for 45% (212 TWh) on iREL generation and 25% (116 TWh) on nuclear power.
[1]
The goal must now be extended further as the COP21 recommends reaching zero emissions by the end of the century.
[2] The average European currently emits 1.5 to 3 tC per year (multiply by 44/12 = 3.65 for CO2 tonnes). The French, as the Swiss and Swedes are in the lower part of the spread, thanks to their almost carbon free electricity production. The Danes and Germans are closer to 3 tC and the Americans to 5 to 6 tC per capita. At the European level, if a factor of 4 is set for the French, that of the Germans should be at least 6. Or, with a somewhat different balance, the factor could be 3.5 for France and at least 5 for Germany.
[3] A common mistake confuses energy and power. Energy, measured in Watt-hour or toe (1 toe = 11.63 MWh) is the quantity that has to be managed, not power which is measured in Watts.
[4] ADEME - Agence de l'Environnement et de la Maîtrise de l'Energie - (French Environment & Energy Management Agency). This organization has since presented a 100% renewable energy scenario.
[5] Not enough for a viable industrial sector, from both the technological and the financial point of view. This is in agreement with ADEME's ultimate goal, the same as that of Negawatt, nuclear phase-out.
[6] ANCRE - Alliance Nationale de Coordination de la Recherche pour l'Energie (French National Alliance for Energy Research Coordination)
[7] Negatoe 2011 data presented at the DNTE sessions. These values are somewhat modified here in the updated Negatoe 2017 scenario.
[8] Note that France, the organizer of the COP21, proved very shy, quite silent, even somewhat shameful, concerning its current performance which, however, places it in the lead for low carbon dioxide emissions relative to other European countries, thanks to its nuclear power.
[9] Carbon dioxide sequestration could be a solution, since carbon capture and storage can reduce emissions by a factor 3 or 4. This technique is being developed and could apply to large units producing electricity, hydrogen, or synthetic fuels from coal. Progress and promises of this option should be monitored along three facets, i.e. energy consumption, environmental issues related to CO2 storage, and cost. A significant contribution of this technology to the struggle to mitigate climate change, however, cannot be expected at the global scale before 2050.
[10] Up to the end of the 1950s domestic coal was the base of electricity production in France. The availability and low cost of oil on the international market starting in the 1960s led to the development of oil-fueled power plants rather than coal-fired plants for new facilities but also to the retrofitting of existing plants from coal to heavy oil. The 1973 oil crisis challenged this transfer with an occasional return to coal. But the onset of nuclear power changed the deal positively.
[11] At the world scale, certain values are expressed in EJ (exajoule) with 1 EJ equal to 10 to the power 18 joules (1018joules); 1EJ is equal to 277 TWh (heat).
[12] These coefficients vary slightly (a few %) among authors and organizations (e.g. the global appraisal published by the French Environment and Energy Ministry is lower by 9%). This is a secondary issue in this instance as we mostly analyze variations, such as the factor 4.
[13] Thus, for a coal-fired power plant whose thermal efficiency is 40 % the per toe emissions are 1.17/0.4=2.92 tC or 10.65 tCO2. Since 1 toe=11.65 MWh, the per MWhe emissions are 0.25 tC or 0.91 tCO2.
[14] The attentive reader will notice rounding errors in the tables. These are due to the difficulties inherent to the gathering of coherent data from different sources, but they do not markedly affect the orders of magnitude.
[15] The 2015 quantitative data are taken from the 2015 Energy Appraisal for France (Bilan énergétique de la France pour 2015) published by the French Environment and Energy Ministry.
[16] Includes imports (fossil fuel based) and the so-called national resources (biomass, nuclear power, renewables ...)
[17] For example, the Negawatt scenario, which makes a point of phasing-out both nuclear and fossils, manages to reduce primary energy production by 76 Mtoe, i.e. by 30%, just by replacing nuclear power with renewables, thanks to this conversion bias. An energy gain, only on paper, that has no impact whatsoever on carbon dioxide emissions.
[18] Fossil fuels (coal, gas, very little oil) contribute to electricity generation along with nuclear and renewables (mainly hydro). We call to mind that the values given here are for final energy, not to be confused with primary energy production values and their ambiguities given above.
[19] Of which 3.8 for steel industry
[20] Non electricity renewables here. Renewable electricity sources (hydro, wind, photovoltaic) are included under electricity. If, on the contrary, renewable electricity is included here, the renewable total is 23.2 Mtoe or 15.5 % of the total final energy.
[21] Including pumped storage which amounts to 6 TWh produced for 8 TWh consumed.
[22] Energy taken from nature (ground source, groundwater, air, other water sources ...). This is not counted in the overall final energy evaluation since it proceeds indirectly from electricity use. However, it is counted here because it can be assimilated to solar heat and deep geothermal energy.
[23] The population of France is 67.6 million with 64.8 million for mainland France. The population of Germany is 82.8 million.
[24] The difference is enhanced when electricity generation alone is considered with, for France 568 TWh of which 7.3% fossil fuels and, for Germany, 628 TWh of which 55% fossil fuels, mostly brown coal. For electricity production alone, Germany's per capita emissions are about 7.4 times those of France.
[25] Germany still has 7 nuclear plants, with 8 reactors in operation (6 PWR and 2 BWR) representing a capacity of 11.3 GW (France 63 GW), producing 92 TWh (France 437 TWh). Complete nuclear phase-out is planned for 2022.
[26] The oil barrel price was below $20 (2012 dollar reference) until 1973. It soared to more than $100 during the 1973 and 1980 crises, returned to less than $40 until 2009 and rose again, stabilizing around $100 after the 2008/2009 financial crisis. It then collapsed, returning to around $40 with the development of shale gas in the USA and the decision of countries with low production costs to refrain from reducing their production.
[27] The opposite direction was taken recently with the RT2012 regulation which, through a simple energy conversion coefficient trick, gives gas an advantage over electricity, thus necessarily increasing carbon dioxide emissions since most of the electricity used for heating is carbon free.
[28] DGEMP: Direction générale de l'Energie et des Matières premières, now DGEC: Direction générale de l'Energie et du Climat (general Energy and Climate board, reports to the ecology administration).
[29] In linking final consumption to primary production the 64 TWh export/import balance in favor of exports must be taken into account. This amounts to 5.5 Mtoe final consumption but 14 Mtoe primary production, yielding a 246.5 Mtoe total (260.5 - cf § A1-14) that corresponds to the 149.2 Mtoe final consumption.
[30] Key energy figures, 2015 edition from the sustainable development commission (commissariat au développement durable) the emissions would amount to 335 Mt (with a 1990 reference point of 366 Mt). Beyond the coefficient dispersion that we noted in the introduction, this small 3% discrepancy must be an indirect reflection of not taking into account of the entire energy chain, from well to usage and intermediate losses, in addition to climate change effects. These discrepancies are not significant and the most important issue is the relative variation up to 2050, within consistent evaluation rules.
[31] The question arises: why so much zeal (23% compared to the EU 20%) while France emits much less CO2 than the average EU country, in particular 50% less per capita than Germany.
[32] In this chapter, we prefer MWh units rather than toe because they are the obvious reference for electricity but also for gas (where the kWh is more commonly used for billing and comparisons than the gas meter's m3 units). Whenever necessary to avoid confusion, we will denote MWhe for electricity and, for heat, MWht.
[33] Population increase, more single parent families, aging population, etc.
[34] Some extremist discourse considers that persons living alone such as widowers should "open to youths and share".
[35] These comprise most of the dwellings labeled "electric heating" which were better insulated than the others (including those with natural gas heating). As the installation cost was lower than that of oil-fueled or gas-fueled central heating, it was possible to spend more on better insulation solutions which would reduce energy expenditures.
[36] Including insulation of the roof, the walls (interior or exterior), the openings (frame and double or triple pane windows) and proper ventilation (two way ventilation with heat recovery).
[37] For example, a 200 kWh/m2 consumption can be reduced to 100 or 50 kWh/m2.
[38] Consider also that many older residences can have received simple heat renovation work, such as attic insulation, without being counted as renovated.
[39] Data taken from "ADEME Chiffres clés du bâtiment, edition 2013" (ADEME key figures in the building sector, 2013 edition) and adapted to 2015 for consistency with § A. Small data differences (a few %) may be observed, not only with other measurements, but also within the ADEME document (climate variations ignored or taken into account). Such possible variations do not affect the approach which is intentionally relative and global.
[40] The share of gas has increased significantly with the RT2012 legislation, at the expense of direct electric heating, in new constructions with the enforcement of the RT. This is not in favor of carbon dioxide emissions reductions but proceeds from a countercurrent political decision. The same is true indirectly in the case of renovations, even if the RT does not apply fully.
[41] Because of the very poor efficiency of today's fireplaces and wood-burning stoves, this percentage does not reflect the relative consumption.
[42] This consumption discrepancy between recent and older buildings, about 40%, is also a function of the mean surface increase (+30%). Overall, the losses relative to the unit area in new buildings are roughly half those in older buildings, reflecting the gain obtained if the various thermal regulations (RT) are applied.
[43] In collective housing, the temperature is set at the furnace output leaving little leeway for individual adjustment. Residents generally resort to individual electric radiators as can be seen each year with the number of radiator purchases. This intensifies the evening electricity demand peak as well as the extreme power demand during cold spells when electric heating comes as a backup to insufficient non electric base heating.
[44] Thermal regulation 2012 that applies to new buildings.
[45] Clearly, with this new regulation introduced on the sly and with no evaluation, it is nuclear electricity that was targeted.
[46] Le Grenelle de l'Environnement was a set of extensive political meetings organized in France from September to December 2007. It covered actions to mitigate climate change, in favor of biodiversity, and to limit pollution. Its main purpose was to guide strategic decisions in the field of environment, but nuclear energy was not included in the discussions;
[47] OPECST: Office parlementaire d'évaluation des choix scientifiques et technologiques (parliamentary commission for the evaluation of scientific and technological choices).
[48] The value for the H2 climate zone (West and South West). It is scaled up to 60 for the H1 zone (North, East, Center, eastern Center) and it is scaled down to 40 for the H3 zone (Mediterranean border). The values were about twice as large in the RT 2005 where fossil fuels were concerned and were somewhat larger where electricity was concerned, taking into account its small carbon dioxide emissions (190 for the H2 zone).
[49] Cepmax : Consommation maximale d'énergie primaire pour le logement (Maximum primary energy consumption for a dwelling).
[50] Particularly so if the OPECST proposal to limit CO2 emissions at 50 g/m2 is retained. Indeed, for a gas heating system, the heat losses would have to be on the order of 0.23 kWh/m2.yr
[51] J. Orselli - report N° 004834-01 to the Conseil Général des Ponts et Chaussées "Les économies et substitutions d'énergie dans les bâtiments" (February 2008) "Energy Conservation and Substitution in Buildings"
[52] Wherefore a big gap between final and useful energy values.
[53] The Orselli report thought it would be 20 000 but new data tend to be closer to 30 000 for 70 m2 mean surfaces.
[54] Add to that the cost of living area reduction in the case of interior wall insulation, and subtract the costs of diffuse renovation. All in all, let us consider that the two compensate each other.
[55] A little more for housing built before 1975, a little less for housing built after 1995.
[56] With a 4% discount rate over 20 years, the cost for each MWh/yr saved in the process of reducing the consumption from 10 to 5 MWh/yr is more than 200 € (or nearly 2 500 €/toe).
[57] This hybrid heating solution that turns off electric heating during winter demand peaks (peak shaving) has the additional advantage that the existing furnace lifetime would be extended several years thus providing a medium term financial gain. When the furnace has to be changed, however, the whole heating scheme should be revised and the associated investments made, unless a mixed energy furnace is installed. These have recently become available.
[58] 5 000 standard maintenance + 10 000 insulation cost
[59] The Jevons paradox (rebound effect) applies to all domains; it deals with the consequences attached to efficiency improvements in production systems. Any unit cost reduction saves money that becomes available for additional consumption of products or services, until a new budget limit is reached. This is clearly evidenced in the CREDOC survey as applied to housing which says: "the greater ease with which the temperature can be kept at a high level in the rooms of a dwelling thanks to better insulation and ventilation induces residents to increase their level of well-being". For convenience, Negatoe includes in the Jevons paradox the probability that none of the older housing is torn down or renovated and that none of the new housing satisfies the new housing norms in the long term (a relevant comment issued by the OPECST in its report concerning RT 2012).
[60] This "smart grid" equivalent has been put in place a long time ago and it should not be ignored. Fostered by low tariffs and already remotely and automatically driven, this system favors night time operation. It could be significantly improved by expanding the timetables to better distribute the night hours and avoid enhancing the new small 10:30 PM demand peak. Contrary to some common claims, this does not change the final energy consumed but smooths the instantaneous power demand, thus minimizing installed power investments.
[61] Distributed as follows: cold chain 23%; audiovisual media 20%; information technology 15%; laundry 15%; lighting 12%; other 14% (ranging from any personal device ... to the elevator).
[62] In particular, low energy light bulbs do not always result in total energy consumption reduction, they can even, in some instances, increase CO2 emissions (P. Bacher - "L'interdiction des lampes traditionnelles : une fausse bonne idée" - TechnAgora -23 juillet 2009- "Traditional light bulb phasing out: not such a good idea")
[63] www.hprevot.fr - « Effet de serre, indépendance énergétique – facteur 3 en 30 ans » (Greenhouse effect, energy independence - factor 3 within 30 years).
[64] http://www.ufe-electricite.fr/IMG/pdf/ufe_etude_1_.pdf
[65] See footnote of § D 2.1.3.b
[66] Before the 1973 - 1979 oil crises, industrial energy consumption increased by about 1% for each 1% increase of the value of the products. As a consequence of the increased cost of energy from 1973 to 1980 the value of energy conservation became obvious. But, as soon as 1990, the efforts weakened as a consequence of the return to cheap oil.
[67] Eliminating all fluid flow modulation losses
[68] In particular with the development of plate heat exchangers that are simple, compact and affordable.
[69] Correcting the considerable scaling down of the share of industry in the GDP, from 16.5% to 12.3% of the GDP between 2000 and 2014. Note also that a new start for production activities in France, which is desirable from the employment perspective, could lead to higher values.
[70] The progress achieved regarding the environment is much larger concerning the other pollutants (NOx, HC, fine particles,..) with sometimes a tenfold gain. But these gains on other pollutants are often obtained at the expense of the CO2 emissions reduction target.
[71] With a large difference between the work day city average (1.3 passengers per car) and family leisure (about 2.5).
[72] In particular high pressure direct injection, variable distribution, downsizing, development of today's hybrid vehicles, on to rechargeable hybrid vehicles.
[73] The development of public transportation powered with carbon free electricity is already contributing to this effort; it should be intensified.
[74] CCS can apply only to large point sources (transformation factories), not to car exhausts. The CO2 produced by vehicles running with GTL or CTL fossil fuels, then, will, at best, be identical to that of today.
[75] This is the solution Sweden chose, by importing from Brazil 95% of the ethanol needed.
[76] In the case of second generation biofuels, for instance, the mass return (ratio of oil equivalent mass produced to the initial dry matter mass) is in the 15% to 20% range. With external energy input (allothermic process) a 40% return can be hoped for. This would translate as follows: from 5 tonnes dry biomass, instead of producing 1 toe and consume a portion of the biomass in the process to produce the needed heat, 2 biofuel toe could be produced from the same mass with 1 toe (11.6 TWh) electric energy input. Other options are possible, such as hydrogen feed in.
[77] Technical and economical evaluation of enhanced biomass to liquid fuel processes Jean-Marie Seiler*, Carole Hohwiller, Juliette Imbach, Jean-François Luciani - Commissariat à l’Energie Atomique et aux Energies Alternatives/DEN-DRT/
[78] Also the family car with the deployment of fast or ultra-fast charging terminals or thanks to the temporary use of a range extender system (rental).
[79] The charging could be done in the night hours when the production margin is large. If 2/3 of them are charged during 8 night hours, the power demand is 13 GW, i.e. a large fraction of the day/night demand gap (see Appendix 1). No additional installed capacity is then necessary !
[80] This is three times as much as in 2015. A significant marker of the priority that public transportation should enjoy in the coming decades.
[81] The charging of a 25 kWh car battery over 10 hours, for example, requires 2.5 kW installed power, i.e. a quasi standard 10/16 Amp socket.
[82] Taking into account the replacement of 15 Mtoe oil by 5 Mtoe electricity
[83] Reference: the book Les énergies renouvelables, Etat des lieux et perspectives (Renewable Energies, Present and Prospects) by C. Acket and Jacques Vaillant ; Editions Technip 2011; revised 2016 edition.
[84] Breaks down as 9.5 firewood for heat, 1.3 wastes, 0.5 wood fuel for electricity generation, 2.6 biofuels (evaluated as 1.3 final energy because of self consumption during production).
[85] P. Mathis La biomasse, filière d'avenir ? (Biomass, a Future Industry?) Editions Quae 2013
[86] In million hectares : annual crops, pasture, forest and equivalent
[87] Except for a moderately reduced share of meat, materialized in the reduction of pasture land.
[88] Clearly, specializing land for specific crops greatly improves the energy yield. This must be taken into account in the adaptation of forest management, but without jeopardizing the main crop: lumber.
[89] In 2015, about 40% of the 40 million tonnes of household and similar waste are incinerated to produce 1.2 Mtoe (mostly for heat networks).
[90] Not as developed in France (0.5 Mtoe) as in Germany (7 Mtoe). There is, however, a controversy that questions the German model which relies in large part on corn crops to ensure satisfactory farm methanizer operation.
[91] So-called surface geothermal energy derives from groundwater or from the sun's heat on the ground, providing warmth to underground piping (dubbed geosolar). Air source heat pumps, though they are not as efficient (COP effect with low air temperatures and the need for thawing cycles) deserve mention; they are easy to install, so particularly useful in renovation work.
[92] Not including pumped storage which is a net consumer (5 TWh produced for a 6 TWh consumption). This energy balance can be modified with a more dynamic management of pumped storage hydroelectricity (PSH), depending on the economic context.
[93] Variable from year to year, e.g. 75.7 TWh in 2013 and a 50.3 TWh minimum in 2011.
[94] While the share of hydropower relative to renewables is smaller in France than worldwide, the per capita share is somewhat larger in France (1 MWh/ca) than worldwide (0.7 MWh/ca).
[95] No further development after this first worldwide experiment on the Rance (and quasi unique, with an equivalent installation in Korea with 250 MW, recently put in operation). An industry that is all but abandoned worldwide. Note in particular that Great Britain has abandoned its 8 000 MW project on the Severn estuary. It seems nuclear power has been chosen.
[96] According to EDF, the tidal stream potential on the French coast will not exceed 5 TWh. Note the poor success of worldwide development of another marine energy source, that of waves, with, for example the fiasco of the Pelamis project. All marine energy sources are faced with various technical problems.
[97] Average hypothesis to take annual variations into account.
[98] These, with a 16.9 GW total cumulative installed power in 2015 can generate anything between about 0.5 GW and 13 GW i.e. a 12.5 GW spread which adds to the daily demand variation, thus increasing the amplitude of the variations that have to be met.
[99] The potential is evaluated at 5 GW but realizations will tell.
[100] Some French mainland sites have been explored on paper (Cotentin, Pas de Calais, Pays de Caux). A more thorough study, with better prospects, has been done for a 50 GW installation in Guadeloupe, with 1 GWh storage.
[101] MWi stands for installed MW; a large network can never output as much power.
[102] Whether or not the costs incurred for the connections to land are included for these contracts is not specified. They were not included in the first bids that were rejected.
[103] The minimum distance between a wind turbine and dwellings has been the subject of heated discussions and debates during parliament meetings in preparation for the energy transition law. In the Senate, a demand supported jointly by the majority and the opposition proposed to increase the present 500m minimal distance to dwellings (not always complied with) to 1000m, arguing that the existing 500m legislation had not changed while the size of wind turbines had more than doubled. Their position rested, beyond the many local complaints and ongoing lawsuits, on the Académie de Médecine recommendations; as early as 2005, the Academy had recommended, as a protective measure, to suspend the construction of 2.5 MW or more wind turbines closer than 1500 m to residences. The Senate voted a new text based on 1000m, which was rejected at the last reading in the Assemblée Nationale, the Environment Secretary having directly stepped in to prevent this distance increase. The 500m rule still holds. The health of residents is secondary in regard to the ENR (new renewable energies) lobby.
[104] Betz's law: wind power is proportional to V3 (where V is the upstream wind speed); the absolute maximum power
[105] To avoid unmanageable grid overload, it should be possible to enforce wind turbine withdrawal during the few tens of hours when their output is very large (above 50% of the installed power, for example). The production loss would be very small. However, this would require revisiting the conditions currently regulating mandatory purchase.
[106] A new appraisal based on observations extending over the entire year 2013 confirms this European quasi synchrony: Electricité: intermittence et foisonnement des énergies renouvelables (Electricity: intermittence and aggregation of renewable energies) H. Flocard, Jean-Pierre Pervès, Jean-Paul Hulot (Techniques de l'Ingénieur)
[107] The German case is very enlightening; it appears that the very rapid deployment of wind and PV power has overwhelmed the capacity of the various management means, in particular of the VHV network. As a result, when the wind blows strongly, the sun is shining, and the demand is small, the German system has to overflow to the grids of the neighboring countries. This generously subsidized electricity threatens the balance of the whole European system and pulls market prices down to the point that they can become negative!
[108] On a standard day, the nuclear power variations needed to participate to load following are on the order of 5 GW, up to a little more than 10 GW on week-ends. The limit is economical more than technical.
[109] The only saving is non consumed fuel, i.e; about 5 €/MWh. The rest, investments and labor, have to be paid, whether the plant produces or not.
[110] For example, this raises the question of gas fired plant selection: simple gas turbine, very economical from the investment point of view, but with very poor efficiency (25%) or combined cycle gas turbine (CCGT) with better efficiency but more demanding from the investment point of view, thus disadvantaged by irregular operation and, more important, more sensitive to load variations than simple gas steam cycle plants.
[111] See "Negatep 2014 : Réduire les rejets de gaz carbonique. Oui mais à quel coût ?" on www.sauvonsleclimat.org
[112] The case for France where the ocean floor descends rapidly (abrupt coast). Uncertainties remain on whether the cost of connections to land is included in the costs announced. In Northern Europe, costs can be less with ocean floors that are not as deep.
[113] Under such conditions, why exercise self consumption while I can sell the electricity I produce at 600 €/MWh if I am among the first incomers, or at 230 €/MWh if I am among the last, and buy it for 120 €/MWh?
[114] e.g. Montéléger in the Drôme 8.2 MWp (12 GWh) on 17.7 hectares
[115] The Cestas solar power plant located south of Bordeaux was, at its inauguration in December 2015, the solar power plant with the largest capacity in Europe. Characteristics: capacity 300 GWp covering 260 hectares with 350 GWh expected production. Materials are 100% Chinese, installation was in large part done by European displaced workers, on land purchased for next to nothing from the French State.
[116] CSPE: Contribution au Service Public de l'Electricité (contribution to the electricity public service). A tax whose main component is now the financing of feed-in tariffs for electric renewables.
[117] While the power generated by a wind turbine varies with the cube of the wind speed (in fact rather the square of the speed in the usual operating conditions) that of a photovoltaic cell varies linearly with the luminosity and never reaches zero under cloudy skies.
[118] Wherefore the first expiry date invoked for Fessenheim; one year later, the first Bugey units will be invoked, and the first Tricastin units 3 years later.
[119] This is all the more reasonable that the American NRC has allowed an extension to 60 years operation of reactors with the same design, that were commissioned before Fessenheim. In the US, the possibility of extending operation to 80 years is being examined.
[120] 28 TWh in 2015.
[121] Other designs, such as the ATMEA whose unit capacity is smaller (about 1200 MW) can be considered, leading to a different final number of units.
[122] Note that, with a division by more than 10 of the energy consumed to enrich uranium, the self consumption relative to this sector, one of the criticisms once addressed to nuclear power, has become negligible (gaseous diffusion replaced by gas centrifuge).
[123] The reliance on imports is real but, given the small volumes concerned, the fuel is easily stored and at a cost infinitely less than with hydrocarbons. Moreover, the resources are not concentrated in unstable countries, as they are in the case of hydrocarbons.
[124] Progress in the development of this sector has allowed to lower the price estimation by about 15% relative to previous Negatoe estimations.
[125] Mission Interministérielle de l'Effet de Serre (Interministerial committee on the greenhouse effect) La division par 4 des émissions de CO2 d'ici 2050 (2004) - (Dividing CO2 emissions by 4 by 2050).
[126] The energy consumed in transporting the coal and subsequently the CO2 (about 10%) emits CO2 that is not captured. CO2 capture increases energy consumption by 25% per kWh, and capture losses can be estimated at 10% if the cost of the process is to remain within acceptable limits.
[127] For electricity the conversion from final to primary energy includes line losses and the consumption of ancillary devices. Note that, in contrast with 2015, the export/import balance is considered to be even over the average year.
[128] This iREL input, even if limited, has an impact on the financial balance of the nuclear fleet. The cost of nuclear power withdrawal during iREL production peaks has thus been estimated at 4 to 8 €/MWh. This is part of the 40 to 50 €/MWh "hidden" cost associated to renewables. (See the document "Negatep: réduire les rejets de gaz carbonique. Oui, mais à quel coût ?")
[129] Between 1990 and 2015, France's greenhouse gas emissions were scaled down by 16%
[130] A significant decline relative to 2014 when it was 69.4 G€. This is in conjunction with the oil barrel price drop, from $80 to $40.
[131] Taking things to the limit, fossil fuels too are free, as long as they are untapped. There is only one advantage to iRELs: they are available on our territory.
[132] See on : www.sauvonsleclimat.org : « Negatep 2017 Analyse financière ; réduire les rejets de gaz carbonique . Oui mais à quel coût ?
[133] See the detailed assumptions in the economical study, based on a fossil fuel unit cost which, starting from a particularly low value in 2015 is assumed to increase up to twice that value by 2050. The end result is a doubled unit cost but the purchase of one fourth the amount.
[134] With, for example, 100€/barrel for oil and 100€/t for CO2
[135]
This was not the case in 2015 when exports were in excess by 64 TWh.
[136] "somewhat further" only, because this sector is not the one where significant reductions of carbon dioxide emissions will occur; the starting value is already close to satisfactory with the already achieved coal phase-out and its replacement with nuclear power.
[137] Averaged over several years around 2008.
[138] A 2 GW additional demand per °C additional temperature drop is an accepted estimation; note that part of this demand is due to auxiliary heating turned on in poorly insulated dwellings that are normally heated by oil, gas, wood. It can thus only partly be ascribed to routine electric heating.
[139] If this represents 8.5% (17/2) the impact on the cost of the unit MWh is about 6€.
[140] The maximum speed of change is practically the same in winter and in summer.
[141] The demand has already started to increase at 8:00 AM, while solar PV is barely waking up.
[142] We evoke here the so often repeated claim voiced by wind proponents that, thanks to wide geographic distribution, aggregation will occur and there will always be wind power, no shortage is to be feared! A statement that proves completely erroneous as far as aggregation is concerned: observations show that wind production drops to almost zero at the European scale during anticyclonic episodes.
[143] It is not obvious that combined cycle gas turbine plants, whose output ratio is better (50% versus 25%) and, as a consequence, which emit less carbon dioxide per unit electricity produced, would be better adapted than direct cycle gas-fueled plants to meet these variations without damage.
[144] Variable from year to year and according to location. The example mentioned comes from the Marignane weather station where wind speeds above average by more than 16% (+50% energy) are observed in March and April but not during the winter months.
[145] The German example in Hunfort with its 290 MW capacity and its 2 hour autonomy does not conduce to considering this as justifying further development.
[146] Assuming electrolysis and fuel cell technological advances.
[147] Fully electric or with heat pumps.
[148] So-called 6 p.m. to 8 p.m. Eco tests on 100% electrical homes, in connection with Linky meters. The so-called peak changes into a demand dip on the order of 20% for these hours that are presently crucial for the installed capacity and peak production backup.
[149] Not by reducing overall consumption as some smart grid promoters argue, but by spreading it better over the daily 24 hours.
[150] Methane CH4 + water vapor yields CO2 and H2.
[151] Not that with CCS only about 3/4 of the carbon dioxide emissions incurred can be captured.
[152] Dependent on the development of fuel cell vehicles.
[153] cf. MYRTE experiment in Corsica.
[154] In a communication to the French Academy of Technology (October 2013) J-P Reich from GDF Suez said there is hope that the cost of electrolysers could decrease to 1000€/kW and eventually even down to 500€/kW.
[155] The combined cost of the fuel cell and the electric propulsion should not exceed the cost of combustion engine propulsion.
[156] This first step is the same for the synthesis of a liquid biofuel.
[157] J.P. Reich (GDF Suez) in his October 2013 presentation to the French Academy of Technology.
[158] Roughly 15 Mtoe according to P. Mathis, op. cit. page 156.
[159] P. Mathis, op. cit. page 162.
[160] Cf https://www.sauvonsleclimat.org/fr/base-documentaire/suggestions-contributions-pour-la-refonte-de-la-politique-energetique-europeenne a comparison of the ECF "roadmap 2050" sponsored by Brussels and of an extrapolation of the SLC-Negatoe scenario at the European scale.
[161] Negatep 2017 Analyse financière - Réduire les rejets de gaz carbonique. Oui mais à quel coût ?
[162] The so-called median ADEME scenario presented during the DNTE. Since then, ADEME has presented a so-called 100% renewable scenario, which deals with the share of electricity separately, scales nuclear power down to zero and anticipates 285 TWh iREL production.