
Jean POITOU
November 2025
Note : translation from French Elisabeth Huffer
In recent years, many parts of the globe have been struck by extreme events: heatwaves, droughts, torrential rains, catastrophic flooding, massive wildfires, landslides in mountain ranges… To understand the trend and determine whether these phenomena are the consequence of changes in the global climate, one has to have access to regular global climate data updates. The IPCC systematically reviews the state of the climate in its reports, but the frequency with which new reports are published is low compared with how quickly the manifestations of global warming evolve. The most recent IPCC assessment of the climate dates back to 2021. The next report is scheduled for 2029, with an intermediate report in 2027 focusing on cities. To ensure that stakeholders—particularly policy-makers—receive proper monitoring, 50 scientists from 40 research institutions (universities and laboratories) around the world have coordinated and founded the ‘Indicators of Global Climate Change’ (IGCC) initiative, which has been producing an annual report since 2023 on the state of the global climate average for the previous year. The data presented below are taken from the report[1] published in 2025 on the state of the climate in 2024.
A climate is characterized by a number of meteorological indicators. Since climate is by nature highly variable, one must consider not the instantaneous values of the meteorological parameters at issue, but their averages over a period that is not too short—typically about ten years. To highlight a possible change in the climate, it is not the value of the indicator itself that matters, but its evolution relative to a previous reference period.
The meteorological variable most often mentioned in climate change discussions is the Earth’s global surface temperature which is measured via ground-based weather observations and by satellites. The indicator used is the evolution of the annual average of this surface temperature relative to the average over the period 1850–1900 (figure 1). For the 2011–2020 period, the difference with the reference period shows 1.09 degrees mean warming. The same average calculated over the decade 2015–2024 shows 1.24 degrees warming relative to the same reference period.
The source of the warming: scientists had already predicted, as early as the end of the 19th century, that a concentration increase of certain gases in the atmosphere would have such an effect. The gases responsible for this effect, the so-called greenhouse gases, absorb infrared radiation. It is thanks to the greenhouse effect that the Earth’s mean surface temperature is around 15°C, making life possible; without the greenhouse effect, the mean surface temperature would be –18°C.
Thus, the Earth’s surface warming has clearly accelerated. Natural climate fluctuations, particularly El Niño[2], have partially contributed to this.
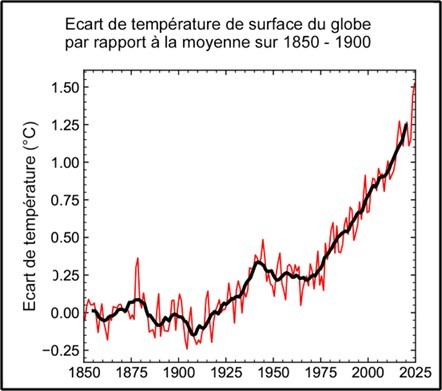
Figure 1: Annual (red line) and decadal (black line) means of global temperature (expressed as a change from the 1850-1900 reference period)
The temperature increase is not uniform across the globe. It is larger at high latitudes and significantly larger on land than over the oceans. Moreover, on land it is accelerating, rising from 1.55 degrees above the reference period for the decade 2009–2018 to 1.90 degrees for the decade 2015–2024. As we will see below, warming affects the environment, which in turn affects the climate
The Greenhouse Gases
The greenhouse gases naturally present in the atmosphere are water vapor, carbon dioxide (CO₂), methane (CH₄), ozone (O₃), and nitrous oxide (N₂O), also known as laughing gas. Human activities release these various gases into the atmosphere along with other greenhouse gases—chlorinated, fluorinated, or sulfur-containing compounds—produced by industry.
Water vapor injected into the atmosphere remains there for at most about fifteen days[3] before being removed by precipitation. In contrast, the other greenhouse gases accumulate in the atmosphere for a duration ranging from about ten years to several centuries before being removed, either through chemical reactions or absorption by water and vegetation on the Earth’s surface. Because of this accumulation, gases continuously released into the atmosphere see their concentrations increase, which enhances the greenhouse effect and thus contributes to global warming.
Of all the greenhouse gases emitted by human activities, one contributes to warming far more than the others: carbon dioxide (CO₂). To quantify total greenhouse gas emissions, the amounts of other gases are converted into ‘CO₂ equivalents,’ corresponding to the mass of CO₂ that would have the same effect as the emitted mass of the gas in question. The total emissions are therefore expressed in ‘CO₂ equivalents,’ abbreviated as CO₂e. Annual CO₂e emissions in the decade 1970–1979 were 30.9 billion metric tons; they rose to 52.9 billion metric tons in the decade 2010–2019 and reached 55.4 billion metric tons in 2023. Emissions are thus still increasing, but the rate of increase has decreased somewhat in the last few years.
Carbon dioxide accounts for three-quarters of greenhouse gas emissions. 90% of these emissions come from the burning of fossil fuels (coal, oil, natural gas). The rest of the CO2 emissions results from deforestation and land-use changes and, to a lesser degree, from the production of cement and steel .
Methane is a gas produced by fermentation: fermentation of waste; fermentation in wetlands (such as rice paddies). A significant share of its emissions comes from leaks during the extraction, transport, and use of natural gas, which is essentially methane. Annual methane emissions increased from 8.4 billion metric tons of CO₂e for the 2010–2019 decade to 9.2 billion metric tons in 2023.
Nitrous oxide (N₂O) emissions come from nitrate-based fertilizers used in agriculture. Over the same periods, they increased from 2.7 to 2.9 billion metric tons per year. Industrial gases, developed for their physical properties and very strong chemical stability, saw their emissions rise from 1.4 to 1.9 billion metric tons per year over the same periods.
Other greenhouse gases, such as ozone, are not directly released into the atmosphere but are formed there through reactions between the atmosphere and short-lived reactive compounds. Ozone (O₃), an important greenhouse gas, is produced through reactions involving various gases emitted by human activities, such as nitrogen oxides (NOₓ) and various volatile organic compounds.
Greenhouse gas emissions and their atmospheric concentrations have been increasing for decades (Figure 2). The COVID crisis caused a temporary drop in emissions; however, because these gases remain in the atmosphere for a long time, their concentrations continued to rise even during the COVID crisis.
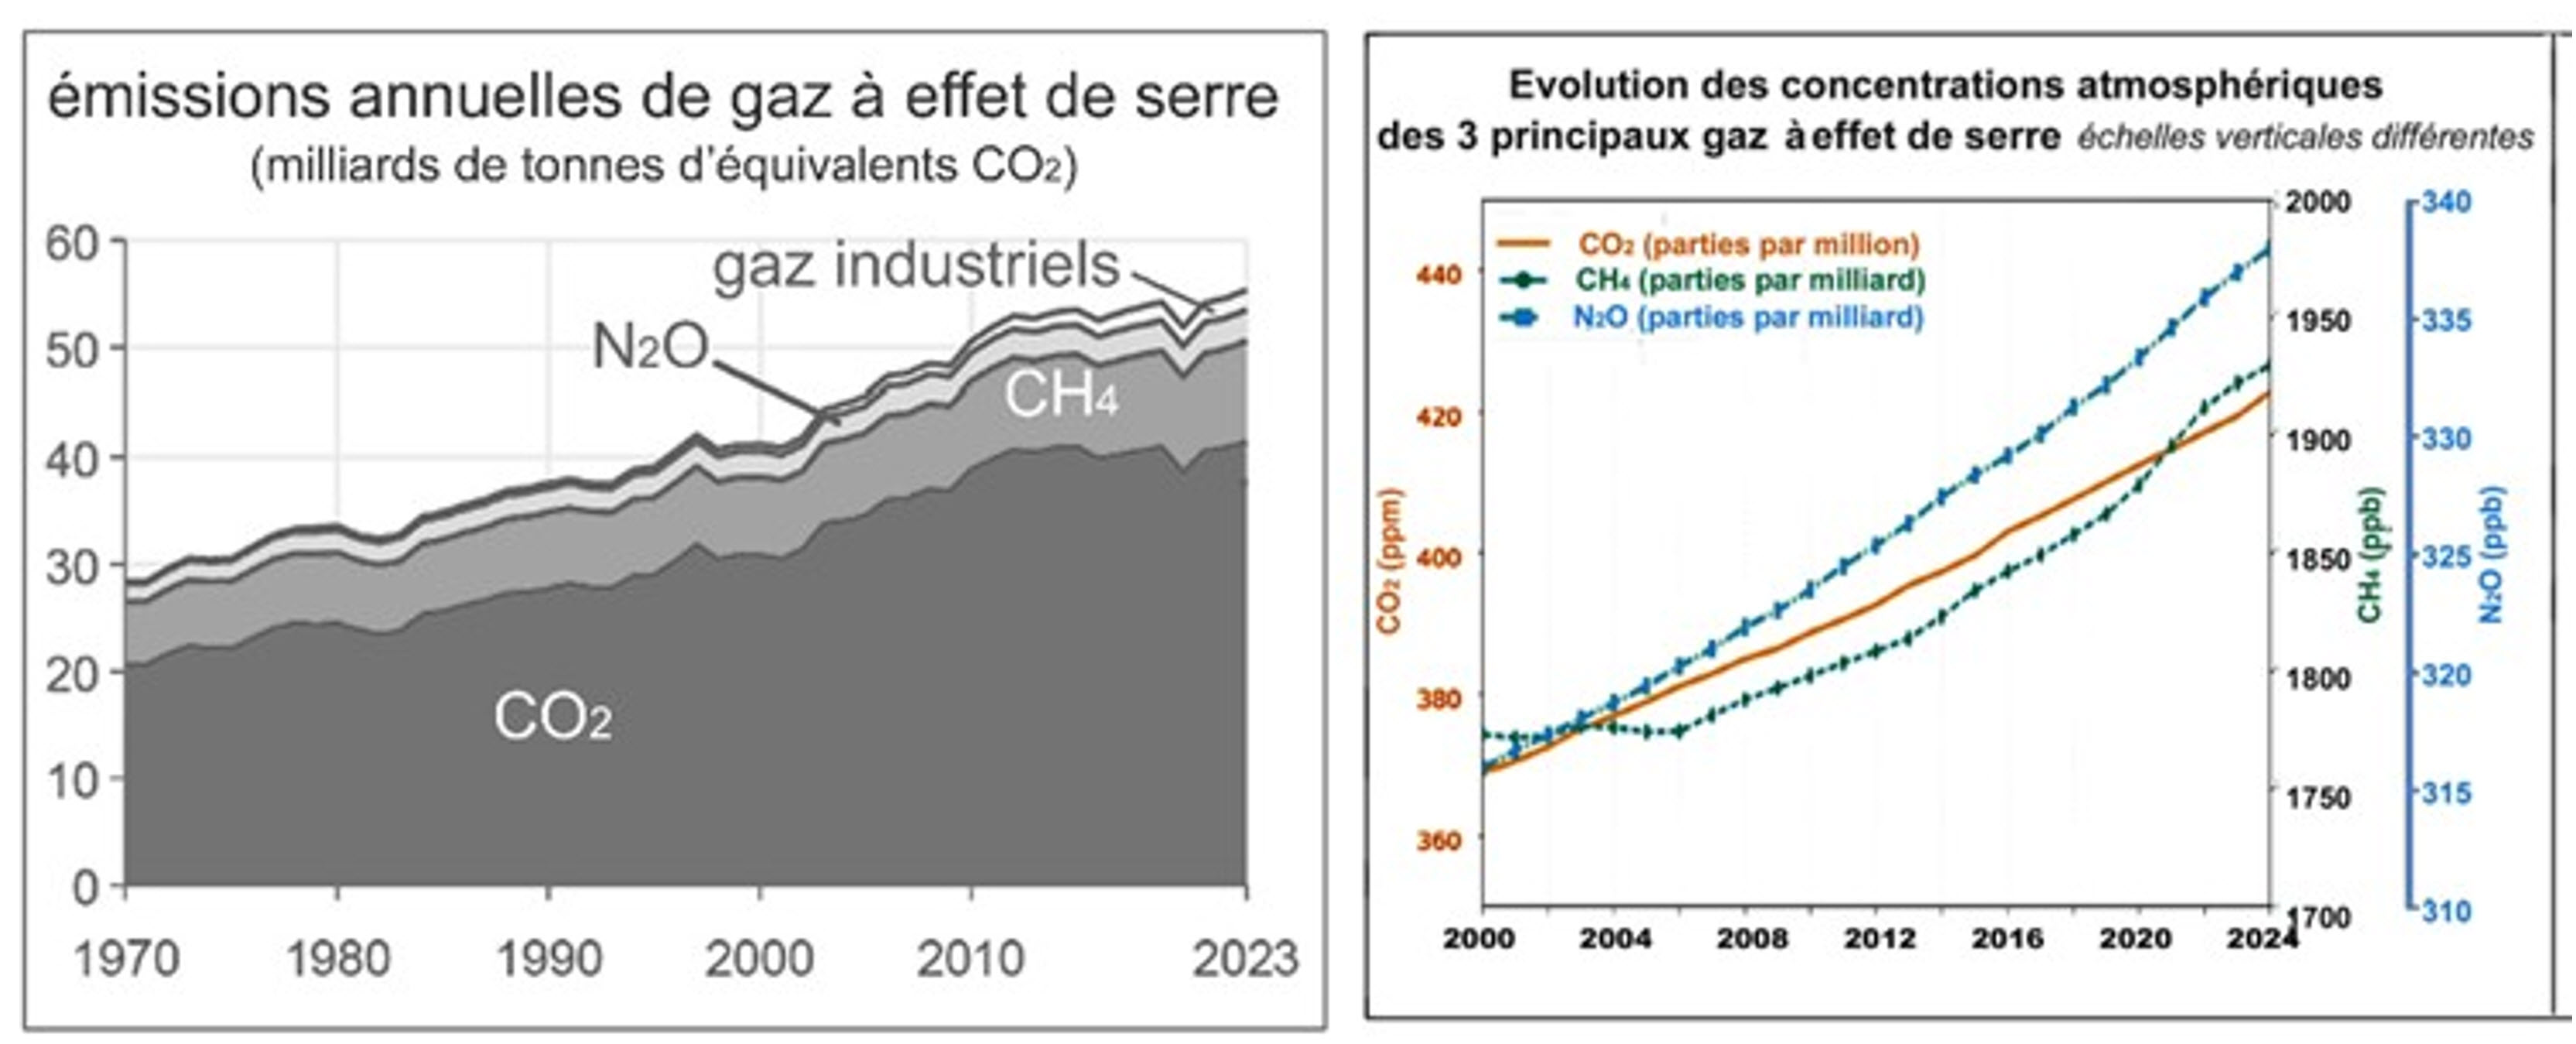
Figure 2: The figure on the left shows the time evolution of greenhouse gas emissions from human activities. Emissions are still increasing, although their rate of growth has decreased over the past decade. The persistence of emissions leads to a continued rise in the atmospheric concentration of these gases (right-hand figure[4]).
Radiative Forcing
The Earth receives energy in the form of solar radiation. All the energy that drives the climate system comes from the Sun. Part of the solar radiation is reflected back into space; the rest is absorbed by the Earth as heat.
The Earth’s surface looses heat by emitting infrared radiation. Part of this radiation escapes into space. If the amount of energy sent into space equals the amount of absorbed solar radiation, the Earth’s average surface temperature remains stable. If these two quantities differ, the temperature rises or falls depending on whether the energy leaving the Earth is less than or greater than the energy received from the Sun. The increased greenhouse effect reduces the amount of energy that escapes into space, thereby increasing the Earth’s surface temperature. The difference between the energy received and the energy leaving the Earth is called the radiative balance. A change in this balance is known as radiative forcing. Various natural processes or human-driven processes (called anthropogenic influences) cause such forcing. Among the natural processes, we can mention variations in solar radiation intensity and volcanic activity. Among anthropogenic processes other than greenhouse gas emissions, examples include aircraft contrails and land-use change, which alters the reflectivity (albedo) of the Earth’s surface... Figure 3 shows the magnitude (W·m⁻²) of the various radiative forcing components in 2024 compared with 1750.
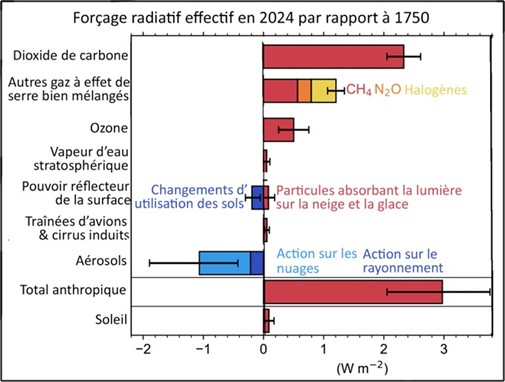
Figure 3: The components of radiative forcing in 2024. The only cooling effects come from land-use changes, which increase the surface’s reflectivity, and, more importantly, aerosols—both via their solar radiation screening effect and via their interactions with clouds, which increase cloud reflectivity. The black horizontal bars indicate the uncertainty ranges.
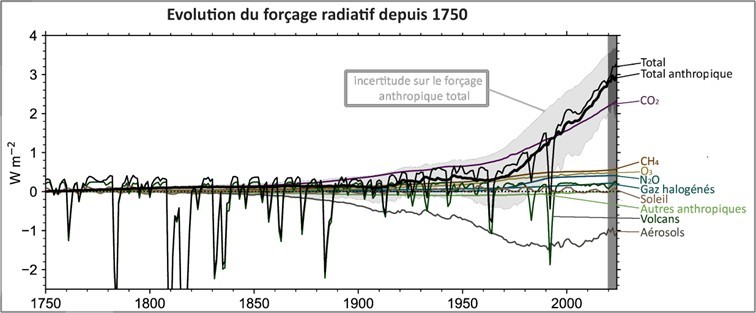
Figure 4: Time evolution of the various radiative forcing components since the beginning of the industrial era. The uncertainty in total radiative forcing is shown by grey shading: the probability that the forcing lies outside this area is less than 5%. This figure also illustrates the major but short-lived (about 2 years) cooling effect of large volcanic eruptions—the most recent being Mount Pinatubo in 1991. Sulfur injected into the stratosphere forms a layer that reduces incoming solar radiation.
All the radiative forcings contribute to global climate warming (Figure 4), with two exceptions:
- Deforestation and urbanization (paving over land) have increased the reflectivity (albedo) of the affected surfaces, reducing the warming of these surfaces by solar radiation.
- Aerosol emissions, which rose significantly with the industrial development following World War II, decreased the amount of solar radiation reaching the ground, thereby limiting warming. Emission reduction measures implemented from the 1980s to curb aerosol pollution have reduced this cooling effect—a trend that has intensified over the past three years due to drastic reductions in sulfur emissions from ships.
Heat stored in the Earth’s surface components
To better grasp global warming, it is useful to consider how much heat is stored by the Earth each year and in which of its components. This is illustrated in Figure 5.
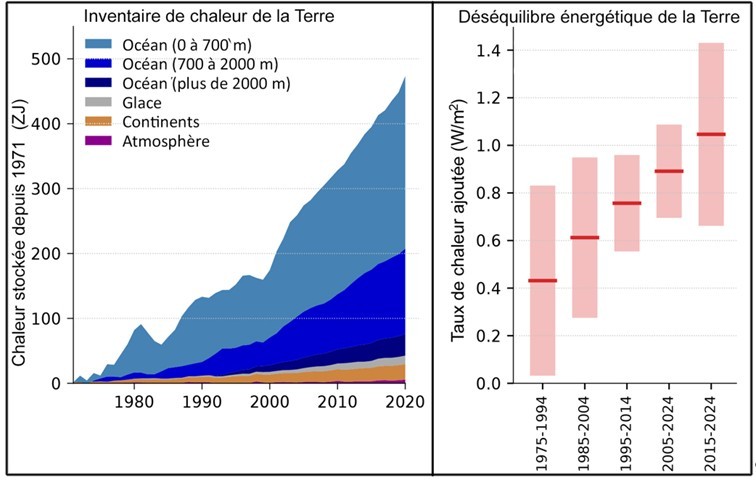
Figure 5: On the left, time evolution of the heat[5] accumulated on Earth since 1971. The oceans have stored 91% of this heat; 5% has been stored by the continents; 3% has been used to warm and melt ice; the atmosphere has absorbed only 1%. On the right, the evolution of the rate of warming in 20-year periods, with the last data point covering the past 10 years.
Human contribution to global warming
Greenhouse gases emitted by human activities are by far the main contributors to the observed warming (See Table 1). As the radiative forcings discussed above show, some human activities have a cooling effect. Natural contributions account for only 4% of the warming.
|
Time Period |
Measured |
Anthropogenic contribution |
Natural Forcings |
||
|
Total human share |
Green house gas |
Other Human-made forcings |
|||
|
2010-2019 |
+1.07 |
+1.09 |
+1.40 |
-0.30 |
+0.05 |
|
2015-2024 |
+1.24 |
+1.22 |
+1.51 |
-0.28 |
+0.05 |
Table 1: share of the various contributors to the accumulated decade-by-decade warming relative to the mean of the reference period 1850-1900[6].
The table shows an increase in forcing from the decade beginning in 2010 to the decade beginning five years later. This resulted in an acceleration of warming at the Earth’s surface. Indeed, the rate of decadal temperature increase rose from 0.26¨C for the period 2010-2019 to 0.27°C for the period 2015-2024. Natural climate variability, particularly the El Niño-La Niña oscillation, partially contributed to this acceleration.
Precipitation over the continents[7]
The Earth’s temperature increase leads to changes in the water cycle. Warmer oceans evaporate more water; plant evapotranspiration increases; atmospheric humidity rises by 7% per degree of warming[8], leading to a 1–3% increase in precipitation and changes in surface runoff.

Figure 6: Various time series of global annual land precipitation measurements. The average trend has not been clear over the past five decades, due to the very strong variability of precipitation.
Overall, specific humidity[9] over land has continuously increased, but the amount of water delivered shows strong year to year or decade to decade variability. It is strongly influenced by El Niño events (anomalies in wind and ocean current systems that occur every 3 to 7 years over the southern Pacific), which determine the monsoon and/or arid periods. Rainfall interannual variations are too large to allow the identification of a clear trend.
Sea-level rise
The warming of ocean water causes its volume to expand and therefore raises the sea level. A second cause of sea-level rise is the melting of continental ice, both polar and alpine, which results in a massive influx of water into the ocean. Before 1992, sea-level was measured with tide gauges. This provided a measurement relative to the tide gauge’s support, which itself could vary in altitude due to land compacting or expansion, as well as isostasy[10]. Since 1992, measurements have been made by satellite, allowing for a much more accurate determination of sea-level. Table 2 shows the strong acceleration of the rate of sea-level rise.
|
Period |
Sea-level rise (mm) |
Rate of sea-level rise (mm per year) |
|
1901-2024 |
228.0 |
1.85 |
|
1971-2024 |
135.8 |
2.56 |
|
1993-2024 |
107.3 |
3.46 |
|
2006-2024 |
70.78 |
3.91 |
Table 2: The rate of sea-level rise has notably increased.
Remaining carbon budget
According to the Paris Agreement (established at COP21 in 2015), warming by 2100 must remain below 2°C and, if possible, should not exceed 1.5°C compared to the pre-industrial era (before 1850). In its «Global Warming of 1.5°C[11]» special report, the IPCC underscored the importance, in terms of climate-change impacts, of limiting warming to 1.5°C rather than 2°C.
The level of warming that will be reached depends on the total amount of carbon that will have been released into the atmosphere. To have a one-in-two chance that warming does not exceed 1.5°C, the amount of carbon still allowed from the beginning of 2025 onward is 130 billion metric tons, which corresponds to less than four years at the current 40 billion tons per year rate of human emissions. For a 2°C limit, the amount allowed is 1,050 billion metric tons, or 26 years at the current emissions rate.
Climate Extremes
Mainly mean global values of meteorological or environmental parameters are considered to characterize climate evolution. But what we are most aware of—what most strongly impacts our lives—are extremes. Extremes are events that are abnormal for the season in which they occur, whether because of their intensity, their duration, or their spatial extent. The year 2023 was particularly rich in such events[12], due to the combination of global warming and, to some extent, natural climate oscillations, of which El Niño–La Niña is an example.
The temperature maxima are constantly rising, and the rate of rising has accelerated in the 1990s (see Figure 7).
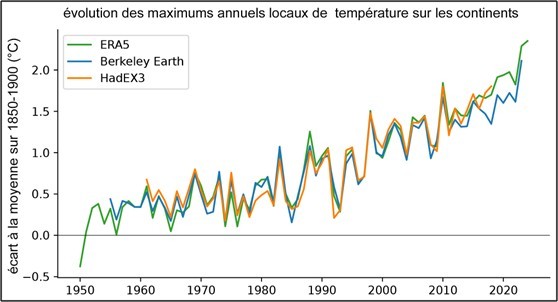
Figure 7: Various temperature time series were used to calculate the land (excluding Antartica) average maximum temperature. This annual maximum has clearly been rising since the 1980s.The values are given as the difference relative to the 1850-1900 mean.
Temperature records were broken in multiple parts of the globe, often simultaneously and very early in the year, with spring heat reaching levels that normally occur only in summer (See Figure 8). Depending on the region, this phenomenon was accompanied by soil moisture deficits (southwestern Europe and North Africa) or, conversely, by excess humidity (Southeast Asia). The Southern Hemisphere’s spring was marked as early as September by intense heat exacerbated by El Niño across large areas of the southern hemisphere.
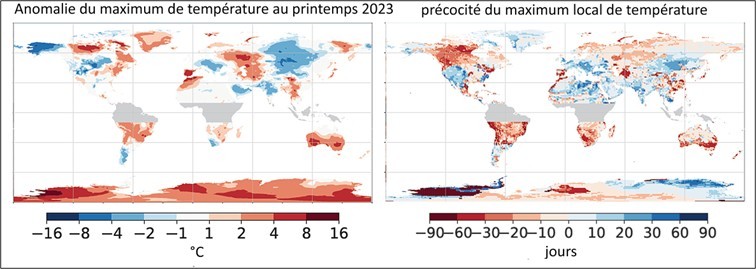
Figure 8: In various parts of the world, during the spring of 2023 in each hemisphere, temperatures reached values significantly different from the spring maximum recorded in those locations over the 1990–2020 period, and often at much earlier dates.
Summer 2023 saw heat records broken across the Northern Hemisphere, often simultaneously, on every continent. Antarctica also experienced exceptional heat, which led to a record low in sea ice extent. In contrast, some regions of the Northern Hemisphere faced extreme cold with unusually heavy snow cover.
Many regions experienced catastrophic rainfall, with extremes reaching up to 600 mm (about 24 inches) in 24 hours. The Indian Ocean produced Cyclone Freddy, which lasted a record 35 days, swept across the entire width of the ocean, and struck the African continent three times. China underwent considerable precipitations punctuated by several typhoons that brought extreme rainfall. The eastern Mediterranean experienced extreme rainfall brought by Storm Daniel.
Various regions have been experiencing drought for several years. Some of these droughts persisted in 2023; in other regions, drought gave way to excessive rainfall or, conversely, intense rainfall gave way to drought. Dry conditions also struck new areas.
Sandstorms were frequent in 2023, with 17 events (a record number since 2011), 10 of which occurred in March and April. The most severe storm lasted 5 days and affected 3.4 million square kilometers in northern China.
The year 2023 also broke records in terms of wildfires. Notably, the massive fires in Canada burned 18.5 million hectares and emitted 1.5 billion metric tons of CO₂—equivalent to the total emissions of the previous 22 years combined. Huge wildfires also devastated the island of Maui, the second-largest island in Hawaii.
These extreme events were especially intense in 2023. El Niño alone could have caused such events, but their magnitude would have been much lower without global warming.
Conclusion
Global warming continues at a rapid pace, with significant consequences that can become catastrophic when a strong El Niño event occurs, as was the case in 2023. Human activity plays an important role in this climate evolution and its impacts. A drastic reduction of human-made greenhouse gas emissions must be achieved urgently, especially those of carbon dioxide produced by the combustion of fossil fuels: coal, oil, natural gas.
[1] Indicators of Global Climate Change 2024 : annual update of key indicators of the state of the climate system and human influence, Piers M. Forster et al. (https://essd.copernicus.org/articles/17/2641/2025/ )
[2] One of the characteristics of an El Niño event is a warming of the equatorial Pacific, which leads to an increase in the Earth’s global average surface temperature.
[3] The amount of water vapor that can remain in the atmosphere depends only on the atmosphere’s temperature, regardless of the amount that is injected. The water vapor entering the atmosphere comes primarily from evaporation over the oceans.
[4] Concentrations are expressed in parts per million (ppm) by volume for CO₂ (left scale) and in parts per billion (ppb) by volume for CH₄ and N₂O (right scales).
[5] The unit used is the zettajoule (ZJ). The prefix "zetta" represents 1021, which is one thousand billion billion.
[6] Given that the values for the various parameters come from disparate measurement datasets, it is not surprising that the sum of the values of the individual components of radiative forcing is not exactly equal to the total radiative forcing.
[7] Precipitation is easily measured on continents and that is where it is especially important for humanity and the environment: for vegetation, for water availability, for the action of water on soils.
[8] Since water vapor is a greenhouse gas, this atmospheric humidity increase enhances the warming.
[9] Mass of water contained in the atmosphere divided by the mass of that humid atmosphere.
[10] The Earth’s upper crust floats on the mantle. A change in the crust’s mass, for example the melting of continental ice, locally causes a change in how the crust floats on the mantle and thus affects the land surface level.
[11] https://www.ipcc.ch/site/assets/uploads/sites/2/2022/06/SR15_Full_Report_HR.pdf
[12] Zhang, W. X., et al., 2024: 2023: Weather and climate extremes hitting the globe with emerging
features. Adv. Atmos. Sci., 41(6), 1001−1016, https://doi.org/10.1007/s00376-024-4080-3
Copyright © 2025 Association Sauvons Le Climat