")
")
Health Impacts of the Different Energy Sources
- Published on 09 June 2018
Health Impacts of the Different Energy Sources
Translation of "Les impacts sanitaires des différentes sources d'énergie"
Author: Roland Masse
Keywords : Fossil Fuels; Nuclear Power, Wind and Photovoltaic (PV) Power; Air Pollution and Health
For the pdf version, click here
Health Costs of Energy
by Roland Masse,
Key words: Fossil Fuels; Nuclear Power; Wind and Photovoltaic (PV) Power; Air Pollution and Health.
Table of Contents
2-2. Impact in Normal Operating Conditions.................................................. 8
2-2-4. Standardization and Comparison of the Risks Involved in the
Electricity Production Process ........................................................................29
- - Introduction
The effect on health of global warming and the depletion of energy resources represents a major component of the external costs of energy.
The impact of the production and consumption of energy on human health contributes to a significant share of the external costs of energy; that is to say to the price that is not paid by the players of the energy market, but rather by the general public.
In the last European analysis[1], an update of the ExternE study launched in the 1990’s, the monetary impact on health is evaluated as ranking third, after climate change, and the depletion of energy resources: Fig. 1.
Figure 1. External monetary costs of energy in Europe (in billion Euros). The impacts on public health are referred to as ‘’Human toxicity’’, ‘’Particulate matter formation’’ a major component of air pollution, as well as a fraction of the costs of” climate change’’, related to a few identified and quantifiable consequences of global warming on human health.
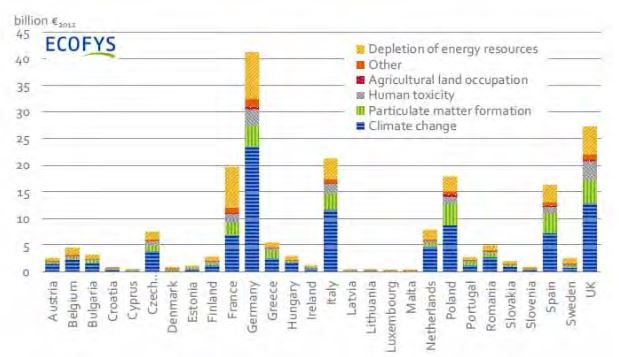
However, the costs of the impacts on health are liable to be revised upwards, considering the uncertainties regarding the cost of emerging global warming related pathologies, which are not included and the ever-increasing monetary evaluation of the worth of human life.
Moreover, a distinctive feature of the impacts on health is that it introduces a significant ethical dimension into the analysis: although the benefits of energy are enjoyed by the entire community, the medical consequences of energy impacts are supported exclusively by the victims. Mutualizing health costs, calculated as the mean loss of life expectancy, implicitly supports the hypothesis that the health burden is shared equitably. This is far from likely if the recognized existence of at-risk groups and the inequitable occurrence of chronic diseases such as cancer are taken into account. This consideration is important in that it has a direct influence on the acceptance of risks, these being difficult to sell on the sole basis of cost optimization.
Ascertaining the health damages that can be attributed to energy, implies that the complete life cycle of each energy sector and of each of its components be considered. This includes the impacts of extraction, transformation, production, transportation and creation of wastes, both in accidental situations and in normal operating conditions.
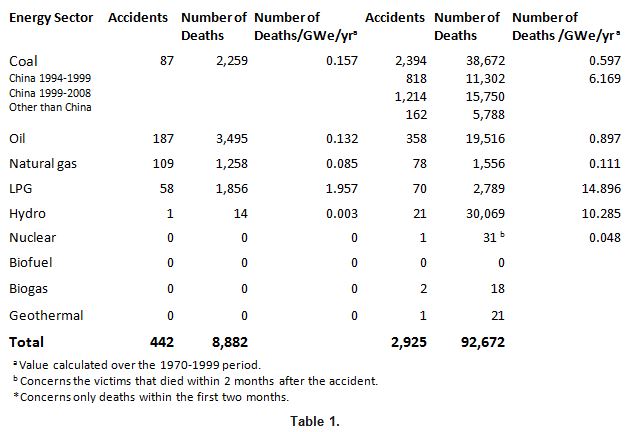
Energy production entails damaging effects over its entire life cycle. First, via the occurrence of serious accidents befalling professionals as well as the general public. From 1970 to 2008, 442 of these accidents were reported in the OECD countries, resulting in nearly 8,900 accidental deaths attributable to, in decreasing order, the oil, gas, and coal sectors. In non-OECD countries, over 2,900 accidents caused more than 90,000 accidental deaths ascribable to coal, hydroelectricity, oil, and gas. Three accidents affected nuclear power plants, of which only the Chernobyl accident caused 31 deaths due to a lethal radiation dose.
The deaths immediately following an accident are well documented only for major accidents involving hydraulic dams, the transportation and storage of fuel oil derivatives, nuclear energy and accidents in coal mines. On the contrary it is difficult to determine the share of victims that are attributable to decentralized energy sources: wind-power, photovoltaic and biomass.
In the case of nuclear energy, deferred deaths among professionals or the public due to cancer or other possible diseases that can be a late consequence of accidental overexposure to ionizing radiations are added to the immediate or very early deaths; the deferred deaths are evaluated according to models whose validity is under discussion in the case of very low exposure; the total number of deaths by cancer after Chernobyl can thus vary from 4,000 to 30,000, depending on whether or not the model is applied only to exposures greater than 100 mS where epidemiological data are available or also to exposures below 100 mSv where we have no epidemiological data.
On the contrary, the delayed consequences on human health of environmental contamination due to energy sources other than nuclear, are not taken into account.
Finally, the collateral effects of accidents that disrupt living conditions, via mandatory evacuations are a major factor of anxiety, whose impacts on human health should be identified carefully. The Chernobyl and Fukushima experiences show that the effects of such disruption can exceed those of direct accidents.
One million residents were displaced because of accidents other than nuclear.
The consequences of the most severe accidents are well known after the ENSAD study (ENergy-related Severe Accident Database) carried out by the Paul Scherrer Institute in 1998[2]. These estimations were updated in 2014 and they now cover the 1970-2008 period[3] .
Table 1. Number of serious accidents and premature deaths attributable to the following energy sectors[4]: coal, oil, natural gas, LPG, hydroelectricity, nuclear power. TA ‘severe accident’ is one that meets one of the following criteria: at least 5 deaths, or 200 or more evacuees; or a ban on consumption of locally produced food, or a hydrocarbon spill exceeding 10,000 tonnes, etc.
In figure 2, the energy sources are compared for the same time period after normalization to the production of electricity; crippling injuries and the number of evacuees is also included.
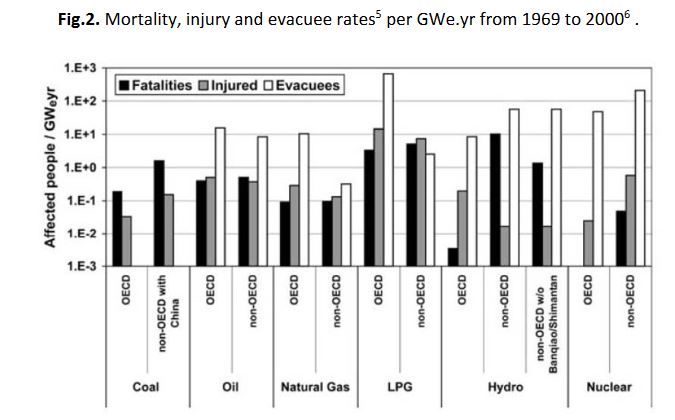
Fig.2. Mortality, injury and evacuee rates[5] per GWe.yr from 1969 to 2000[6] .
The distribution of accidents according to the ENSAD (Energy-related Severe Accident Database) is as follows: for coal, 96% from mining; for oil, 76% from transportation and storage, 15% from drilling and 8% from refining; for natural gas, 78% from transportation and storage, 6% from drilling, and 5% from production; for nuclear, entirely from production.
Deferred deaths attributable to accidental environmental exposure to fossil fuel derivatives and biomass, are not included.
In the case of nuclear power, the death count comes essentially from the extrapolated evaluation of radiation-induced cancers[7] that might appear over a period of up to 50 years after exposure. Today, these cancers cannot be distinguished from those that could be due to other causes in the exposed populations. For exposures greater than 100 mSv, the epidemiological data from Hiroshima and Nagasaki survivors serve as a reference for risk estimation.
Concerning exposures below 100 mSv, no data establishes a risk directly proportional to the dose received; however, to be on the safe side, it is generally accepted today that such a risk cannot be excluded.
Depending on whether this hypothesis is considered valid for all populations worldwide, regardless of how low the doses received are, or whether the calculation is restricted to populations who received doses not off by several orders of magnitude from 100 mSv, the estimated death count varies significantly. Thus, the Paul Scherrer Institute calculation ranges between 9,000 and 33,000[8] deaths occurring mainly at the end of the expected lifetime, all of which are ascribed to Chernobyl. Using the same hypothesis, the TMI accident would yield 1 attributable death.
For the Chernobyl liquidators who, from 1986-1987, were exposed to more than 150 mSv (Unscear 2008[9]), restricting the accountable deaths to radiation-induced cancers underestimates fatalities: excess premature deaths due to radio-induced cardiovascular effects also must be taken into account, these weighing on health about as heavily as cancer. These effects appear only above a dose threshold that is higher than most accidental environmental exposures.
Beyond the direct effects of irradiation, indirect effects resulting from post-accidental crisis management, such as those attributable to territory evacuations, should also be considered. This concerns about 115,000 residents in the Chernobyl area and 160,000 near Fukushima.
This component has its share of health costs, but it is difficult to evaluate. Yet, these indirect effects can exceed by far the health costs directly due to the accident itself. In the case of the Fukushima accident, while ionizing radiation claimed no victims, population displacement and relocation in makeshift accommodations brought the Japanese authorities to recognize about 2,000 premature attributable deaths[10]. The collection of these cases continues more than 5 years after the evacuation. The immediate dramatic consequences of this evacuation in a country devastated by the tsunami of March 11, 2011, only partially explains this administrative account. Also, to be considered are the aftereffects that are suffered by the victims, such as post-traumatic stress; despair resulting from having had to leave their living environment; from being exposed to an insidious danger; and the difficulty of facing an unknown, possibly hostile, social environment. These are the source of many real disorders and a long series of depressive episodes and suicides[11].
In its assessment of the costs of a nuclear accident in France involving 100,000 evacuees, the IRSN evaluates the share of these psychological effects to be between 12 and 22 billion Euros[12] .This post-accident component is probably the heaviest burden on health in the Chernobyl accident; it is at the origin of such extremely pessimistic evaluations as those published in the Annals of the New York Academy of Science by the ex USSR dissidents[13], who conclude—however, with no verifiable methodology – that there were a million excess deaths. After the Chernobyl accident, the early handling of the populations was not organized as it had been for the displaced persons of TMI, or for the populations of Fukushima, so that an exact assessment of its indirect effects on health will never be possible.
The indirect post-accident impacts on health are systematically evaluated for the nuclear sector and only marginally in the case of environmental contamination due to accidents in the petroleum derivative and coal sectors where the cost of environmental damage dominates. They should, however, be considered in such situations, as they should be when the environment is deteriorated in relation with mining activities both in normal and in degraded mode operation (Bayan Obo for rare earths; Alberta for the extraction of bituminous sands; Gazweiler for lignite; the Appalachians in the United States for coal) or in the case of population displacements to fill large dams (Three Gorges Dam: 1.4 million displaced persons according to Wikipedia).
Nuclear energy professionals are monitored by dosimetry and are regular objects of epidemiological studies. Of these, uranium miners occupationally exposed to radon have developed more than 10,000 fatal cancers since 1946, the majority in the former GDR. Other occupationally exposed personnel have a better life expectancy than the general population, however a comparison of the most exposed with the less exposed personnel reveals an excess of cancers and leukemias, on the order of 0.1%, which could be attributable to their exposure. Based on the linear no threshold model we can formulate the hypothesis of about 300 excess cancers for 300,000 nuclear workers studied worldwide in 2015.
The general public is exposed to extremely low doses from installation outflows. These doses amount to about 1% to 0.1% of natural radioactivity. No risks can be linked to these very low dose levels.
In normal operating conditions, just as in accidental conditions, the essential risk factor for professionals and the public is external or internal overexposure to ionizing radiations.
The evaluation of the exposure results from measurements and modeling. For workers other than uranium miners who are exposed to radon, the accumulated dose comes mainly from external exposure, as measured individually or collectively; for the general public, the exposure results mainly from radionuclides escaping to the environment and the dose is evaluated by modeling their transfer to air, water and the food chain, on a local, regional, and global scale. This results in external and internal dose components, whose value is obtained from conversion tables, which translate the becquerels ingested or inhaled into effective doses. The international elaboration of these tables implies that the biological destiny of each radionuclide be known and that weighting factors be used to take into account the type of radiation and to weigh each organ's retention capacity for delayed risks.
Table 2. Collective doses per TWh (sum of individual doses expressed in man-sieverts) in the French nuclear fuel cycle (OECD 2003[14])
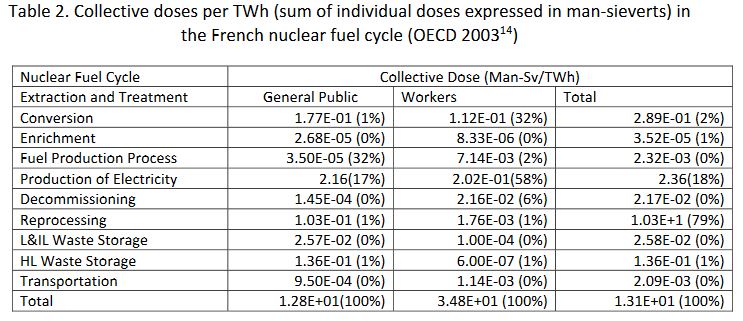
Applying this model to all the nuclear production worldwide, and distributing the doses over the world population, Rabl 2001[15] estimates the dose per person at 2.5 microsieverts per annum. With a slightly different approach, UNSCEAR 2000[16] finds a value 10 times smaller. These dose levels are about one thousandth the natural radioactivity levels, whose impact on health, if it exists, can only be unapparent.
Professionally exposed groups constitute a set in which the health impacts of ionizing radiation exposure can be detected. This is the case for uranium miners who are exposed to radon. More than 10,000 of them have died of lung cancer since 1946, among whom more than 7,000 were in the ex GDR[17], the majority being exposed to extremely high levels. In France, 211 miners died of lung cancer out of 5,000 exposed miners, that is 1.43 times the expected frequency in a comparable non-exposed male population[18]. For other nuclear workers, epidemiological studies find a cancer deficit when compared to the general population, this being interpreted as a healthy worker effect; but what this protection from cancer-related diseases implies, is unclear. Nevertheless, it is possible to discern an effect of ionizing radiation on nuclear workers by comparing among themselves affected personnel who received different dose levels. Again, in keeping with the linear no threshold model (INWORKS 2015)[19], the probability of death by cancer would be increased by 0.1% in the 300,897 monitored worker population, or about 300 excess cancers among the expected 75,000.
Coal extraction entails many occupational accidents and exposes coal miners to pneumoconiosis (silicosis). Nearly 100,000 miners suffered from this in France; and today, this illness still causes, on average, 0.4 deaths per 100,000 inhabitants per year worldwide. In China, the figures show that 500,000 miners are afflicted, with 20,000 new cases each year.
Aside from accidents, coal extraction leads to occupational diseases due to coal dust inhalation: pneumoconiosis-silicosis and lung cancer. From 1946 to 1986, according to French coal mine statistics, 34,000 miners died of silicosis, among a maximum of 330,000 miners in 1950—two-thirds of whom were deep miners, 20% of them having been recognized as suffering from silicosis. These numbers are probably underestimated and the total number of deaths from silicosis has been reappraised to between 80,000 and 120,000[20].
The present average number of deaths per year due to coal miner pneumoconiosis is 0.4 per 100,000 inhabitants worldwide, with about 80 in Germany[21] and 140 in the United Kingdom[22] .
The prevalence of pneumoconiosis-silicosis cases in China currently involves more than 500,000 miners, with a number of new cases probably larger than 20,000 per year. These figures are probably considerably underestimated and should also include more than 10,000 lethal work accidents per year[23].
- 2-2-2-1. Health Impacts of CO2
The accumulation of CO2 in the atmosphere due to carbon-based energy generation is responsible for climate warming and seriously impacts human health in many ways.
The emission potential for coal and lignite is of the order of 350 g/KWh, it is 280 g/KWh for fuel oil and 200 g/KWh for natural gas (CITEPA Ominea). For electricity production, these values are around 1000 g for lignite and coal, 900 g for heavy oil, 750 g for the diesel of electricity generators, and 450 g for Combined Cycle Gas Turbine (CCGT) plants[24].
The annual production of CO2 in France in 2014 was 300 Mt, about half of which originated from oil for home heating, gasoline, diesel fuel and non-road diesel (NRD), and the other half was split between the manufacturing industry, agriculture, and energy transformation, not including the production from biomass (CITEPA-Secten 2016).
The production of CO2 is the risk factor common to all carbon-based energy sources and has a determining role in global warming linked to multiple impacts on health. More than ¾ of the warm days since 1850 have been attributed to global warming and the resulting heat waves caused more than 20,000 premature deaths in France. It also appears, that aside from heat waves, more than 7% of global mortality results from the effects of temperature and that no benefit is to be expected from the disappearance of cold days[25]. Additionally, global warming modifies the distribution of agricultural and water resources, leading to anticipate significant health repercussions that are difficult to assess. Finally, climate change is already having an impact on the distribution of nuisance plant species, some of which cause serious allergies (ambrosia); and on the proliferation in temperate countries of tropical, vector-borne diseases such as the dengue, the chikungunya, and the Zika virus disease. In tropical countries, the evolution of contagious diarrhea is directly linked to global warming, that of malaria as well.
Carbon dioxide is also a factor that exacerbates the impact of air pollution by increasing exposure to ozone and various organic carcinogens[26].
- 2-2-2-2. Toxic Emissions
During combustion, carbon-based energy sources release several gaseous and particulate matter toxic pollutants. Among the most representative are: - CO, NOx, SO2 gases, and ozone formed as a secondary pollutant by photochemical reaction; - non-methane volatile organic compounds; the particulate phase as a whole or subdivided in different granulometric classes according to the level of granulometric cutoff (PM10, PM2.5, nanoparticles…).
The composition of the gases and the particulate matter phase varies according to the energy source: coal, oil, or biomass, and some metallic or organic elements make it possible to trace their origin.
These different components represent several classes of danger— local irritants or systemic poisons—specifically neurotoxic, mutagenic and carcinogenic; however, it is essentially through local action in the respiratory tract and blood vessels that their toxicity is exercised.
The energy sector in France releases several toxic compounds to the atmosphere among which the most significant were grouped by the CITEPA as displayed in Table 3 where the last column gives the share of the energy sector in the global national emissions, all sectors included.
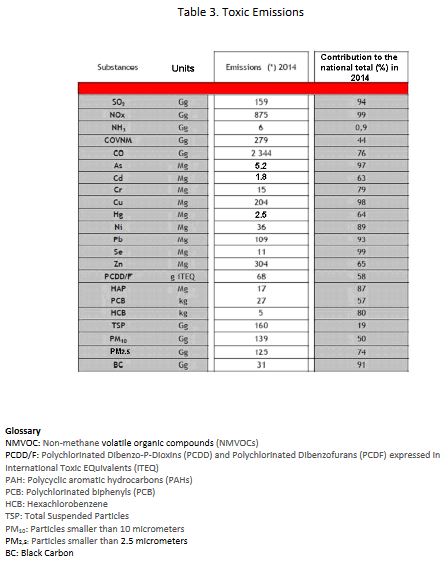
Glossary
NMVOC: Non-methane volatile organic compounds (NMVOCs)
PCDD/F: Polychlorinated Dibenzo-P-Dioxins (PCDD) and Polychlorinated Dibenzofurans (PCDF) expressed in International Toxic EQuivalents (iTEQ)
PAH: Polycyclic aromatic hydrocarbons (PAHs)
PCB: Polychlorinated biphenyls (PCB)
HCB: Hexachlorobenzene
TSP: Total Suspended Particles
PM10: Particles smaller than 10 micrometers
PM2,5: Particles smaller than 2.5 micrometers
BC: Black Carbon
The emissions with the most significant impacts are Particulate matter emissions: Total Suspended Particles (TSP), PM10, PM2.5 and Black Carbon (BC); CO, Nitrogen oxides(NOx) and Non-Methane Volatile Organic Compounds (NMVOC), responsible for the formation of ozone via a photochemical reaction; and SO2, which is a toxic in the gaseous state. Moreover, S02 and NO2 are at the root of a significant secondary contingent of atmospheric particles by NH3 ion-induced nucleation of sulfates and nitrates originating essentially from rural areas. These secondary particles can account for up to 80% of the PM2.5 mass in the atmospheric aerosol and may adsorb volatile elements from the primary emission.
The other constituents have a significantly dangerous potential with neurotoxic effects from Hg and Pb metals and carcinogenic effects from the metals As, Cd, Ni, Cr and from several organic compounds: Polycyclic Aromatic Hydrocarbons(PAHs), dioxins and furans (PCDD/F), hexachlorobenzene (HCB). However, the concentrations reached in the general environment after dispersion are low and modify the global risk only marginally. Nonetheless, these toxic substances can cause the specific toxicity of some inert or hardly toxic atmospheric aerosol particles (nitrates) to which they associate. Note also that the toxic metals, once emitted, accumulate permanently in the biosphere; their being deposited on the ground, their being taken up in the air again and their introduction in the food-chain contribute to their potential impact on health for several generations.
The different sources of energy contribute in various degrees to the degradation of the quality of the atmosphere. This property is characterized by an emission factor expressed in the pollutant grams produced per energy production unit in GJ, as shown in Table 4 taken from the CITEPA publication Ominea 92, for the main constituents, namely NOx, NMVOC, PM10, and PM2.5.
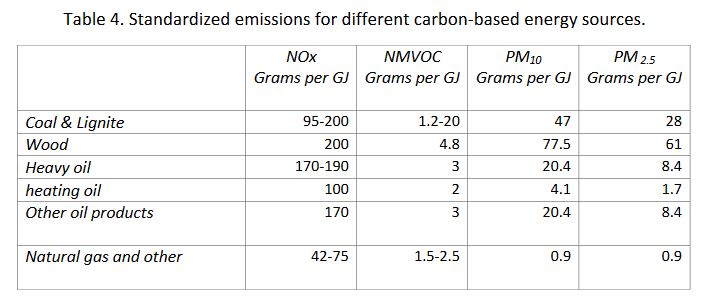
As for As, Cr, Cu, and Pb atmospheric aerosol elements, the main source is wood and biomass combustion, reflecting a short cycle from polluted soils. Concerning cadmium, fuel oils and solvents constitute the largest source, followed by wood and coal. Mercury comes mostly from coal; nickel is a marker of fuel oil products, particularly heavy fuels.
Among the toxic organic compounds: dioxins and furans are produced by waste combustion for about 50% of the emissions, followed by diesel 25%, wood 15% and coal 13%; most PAHs are emitted by wood for more than 50%, next by diesel for 15% and coal 7% ; 40% of the PCBs come from wood, 30% from coal and 14% from oils; half of the HCB results from waste combustion, wood and diesel are each responsible for about half of the rest.
- 2-2-2-3. Impact of Air Pollution on Health
The carbon-based energy sectors all contribute to air pollution as a whole but it is not possible to directly single out their respective share in the impact of pollution on health. It is the cocktail resulting from the combination of these different sources that constitutes the toxic agent.
However, a relationship can be established between different co-variant markers of pollution and different health indicators. The more robust relations are established from the following markers: particles (PM10 and PM2.5), NOx, and ozone.
The respective share of the different sectors concerning the health impacts of air pollution can be approached indirectly from the aforementioned correlations. However, the exact nature of the toxic substance(s) involved, or their interaction, remains poorly understood, so that the reliability of this method remains poor.
Two types of epidemiological studies allow the observation of 1 – short-term effects of pollution peaks and 2 – long-term effects of background pollution. The long-term effects of pollution are by far the most alarming, as they occur at all current levels of urban and rural pollution with millions of cases of cardiovascular and bronchopulmonary diseases and lung cancer.
Concerning short term mortality, the incremental impact of 10 µg of PM2.5 is on the order of 0,6%; concerning mortality corresponding to long term exposure, it is on the order of 5%. Cardiopulmonary diseases are the majority contributor.
However, the large variability of the results leaves room for considerable uncertainty.
Certain systemic diseases also seem to be induced by the present pollution levels although the risk level cannot be precisely established.
It is impossible to evaluate the direct impact on health of each of the toxic constituents released to the atmosphere by the carbon-based energy sources. This said, we know rather well what results from the inhalation of the set of atmospheric particles to which these emissions contribute significantly, combined with the particles from natural erosion and those from various industrial rock grinding operations, whose toxicity is known to be small[27].
Various markers are used to qualify air pollution, among which some are of particular interest: concerning the gaseous components, SO2, NOx, ozone and NMVOC content and for the particulate matter content, PM10, PM2.5 corresponding to particles whose diameter is smaller than 10 micrometers and 2.5 micrometers respectively
Correlating the concentration variations of these markers with different health indicators enables the establishment of a dose-effect relationship. These health markers involve, in particular: - mortality from all causes combined, and mortality specifically caused by pulmonary, cardiovascular, carcinogenic disease; - and morbidity based on the number of hospital admissions, doctors’ appointments and various medical drugs such as those prescribed for asthma attacks.
Schematically, two types of studies are led: Type 1 - those that establish time-related daily correlations between the variations of pollution concentration markers and those of health markers; Type 2 - those that analyze over time the long-term consequences of exposure to air pollutants. With the first type of study, the immediate and slightly delayed effects of air pollution can be ascertained rather easily provided pollutant dosimetry can be established with sufficient resolution and provided reliable medical statistics are available. In early mortality studies, temporal correlations can show an increase in morbidity and mortality that can be attributed to exposure, but they provide no information on the mean years of life lost involved.
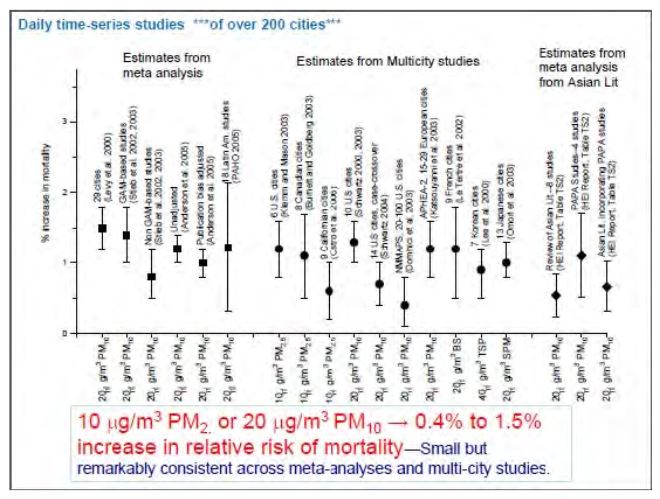
Many studies have provided an evaluation of the impact of particles; an overview of these was proposed by C. A. Pope for EPA in 2011[28] whose results are displayed in Figure 3. A particle increase of 10 to 20 micrograms per m3 of air is correlated with a 0.4 to 1.5% mortality increase due to air pollution.
Figure 3. Mortality associated to 10 to 20 microgram variations in air particles in different parts of the world; evaluation from temporal correlations over at most one week.
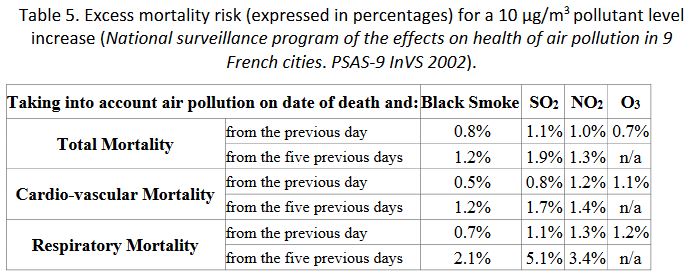
Other air pollution markers yield globally consistent results, attesting the tracing character of these markers but not their degree of toxicity (the effects do not add up) as, for instance, in Table 5.
To study the delayed effects of chronic exposures (type 2 studies), cohorts involving stable subgroups exposed lastingly to different levels of exposure have to be monitored over long time periods. The characteristics must be reconstituted with maximum reliability during the entire duration of the study in order to enable correlations with health indicators. With these cohorts, it is possible to evaluate the mean years of life lost according to age groups versus cumulative exposure, but they do not allow to identify the victims.
In 2011[29], CA Pope proposed an overall synthesis of the findings resulting from the main research studies available concerning these cohorts, expressing excess mortality as follows: all causes, cardiopulmonary diseases (CPD), cardiovascular diseases (CVD) and ischemic heart diseases (IHD). The results are shown in Figure 4.
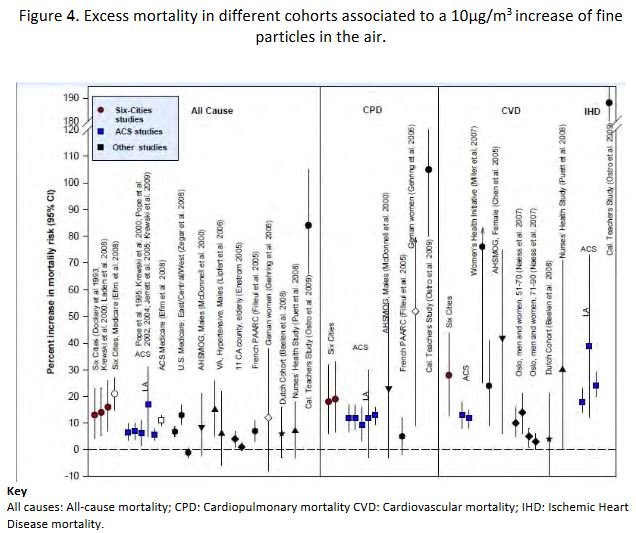
The validity of these correlations is confirmed with the development of exposure reduction policies. Thus, it has been possible to observe the decrease of the mortality rates correlated with the decrease of exposure to fine particles using the same markers and the same methodology
The results demonstrate a significant variability, which may reflect both the diversity of the cohorts and that of the toxic constituents. For mortality due to all causes, an essential indicator of the health impact, a meta-analysis was proposed by Hoek et al[31] in 2013; it was updated by the WHO, after the results of the European Escape cohort (367,250 participants monitored for 14 years). The results obtained indicate a relative risk figure of 1.07. The Escape figure yields 1.14 but because of its weak statistical power, in comparison to the millions of participants in the American surveys, it has little effect on the results of the meta-analysis. However, this central value, which attributes a 7% excess mortality per 10 micrograms per m3 increment of PM2.5, carries a high measure of uncertainty.
The degree of uncertainty was evaluated in the United Kingdom by the 2010 COMEAP study[32] that concludes that the excess mortality per 10 µg/m3 for PM2.5, lies between 1% and 12%, with a probability evaluated at 0.75. In terms of attributable mortality, this is equivalent to 4,700 – 51,000 deaths in 2008 for the entire English and Welsh populations.
Thus, most of attributable deaths, despite the uncertainties, is indeed due to the delayed effects of long-term pollution and not to pollution peaks. This is reflected in the present pollution levels observed in France, namely between 10 and 15µg/m3 on average for PM2.5[33].
The evaluation of the relative share of the pathologies specifically linked to air pollution has received variable results for the 3 main categories: pulmonary, and cardiovascular diseases, and lung cancer. Based on the American cohort studies, cardiovascular diseases, constantly observed in all investigations, are the cause of the great majority of premature deaths, followed by lung disease and cancer. For cancer, a central value obtained from the meta-analysis[34], gives about 9% of new lung cancer cases per PM2.5 or PM10 10 µg; however, this value can reach up to 22 % in the Escape study concerning the European urban populations[35]. These evaluation differences may be due to smoking. In the meta-analysis, the carcinogenic effect of particles is minimal among smokers (6%) and maximal among former smokers (44%). There are fewer morbidity studies than mortality studies, particularly regarding chronic effects; many deficiencies hamper the evaluation of the global impact. The better-established correlations concern the link with asthma in children and bronchopulmonary diseases in patients older than 65[36]. For cardiac and vascular pathologies, the relationship is more erratic. Recent data, however, link chronic exposure to air pollution and atherosclerosis, this being confirmed by the observation of specific signs of vascular damage induced by PM 2.5[37].
More tenuous links have been proposed between air pollution and various diseases such as type 2 diabetes, renal diseases, infertility, premature delivery, neurocognitive developmental disorders, autism, Parkinson’s disease, and different kinds of cancers, but all of these effects cannot be quantified at the present time. For lethal diseases, however, the overall outcome cannot possibly lead to an evaluation that is higher than that available from all-causes mortality studies; this evaluation is already covered by the sum of deaths, strongly related to pollution, that are attributable to cardiopulmonary and cardiovascular diseases.
- 2-2-2-4. Identified Toxic Effects
Certain components of air pollution: CO, in accidental conditions; SO2 associated with historical large-scale smog; and ozone, indisputably mark their effects beyond the concentration thresholds that can occur in ambient air.
The concentrations reached by nitrogen oxides lie below values associated with toxic effects.
The inhalation of atmospheric particles from urban aerosol is linked to multiple effects that depend on the airway territory where these particles deposit. The PM10 component is linked to bronchial irritation; the PM2.5 component is associated with vascular cell suffering; the ultrafine component escapes local sequestration and migrates via the blood circulation to various organs. The most constant toxic mechanism is the induction of oxidative stress.
It is not possible to determine whether the vascular toxic effects of PM2.5 are physical in nature or are associated with the absorption of toxic minerals and organic matter. There is consensus to consider that natural particles from sea spray and erosion are not involved, whereas carbon-rich particles are, systematically. There is an ongoing debate concerning the role played by sulfate and nitrate particles. In practice, ozone for its acute effects and particles for both their acute and chronic effects are the more pertinent exposure indicators to characterize the dose-effect relation. Their effects are revealed at the emission location and at distances up to several hundred Kms.
Within the range of environmental concentrations observed, a linear no-threshold dose-effect relation accounts for most of the epidemiological observations. This relation does not rest on a plausible toxic mechanism that would allow extrapolating the observations.
The evaluation of systemic effects, possibly due to the impacts of neurotoxic, carcinogenic and mutagenic emissions to the environment during the combustion of carbon-based sources, must be assessed indirectly by way of modeling.
Carbon monoxide CO. Carbon monoxide poisons hemoglobin by interfering with the transport of oxygen to the tissues. It is the origin of more than 3,000 diagnosed intoxications in France every year, and of about one hundred deaths caused in homes by defective heating systems. Chronic exposure is associated with a risk of ischemic heart disease.
In ordinary ambient air concentrations, the CO levels are 50 times below the toxicity threshold.[38]
Historically, S02 is associated with dramatic pollution episodes, such as the great smog of London in 1952. Current emissions do not reach such atmospheric concentrations larger than 500 µg/m3, the toxicity threshold for short-term exposure. However, there are correlations that point to an excess of all-cause mortality on the order of 0.5% for a 24 h exposure to each 10 µg/m3 overshoot beyond contemporary exposure levels (about ten µg/m3). Strong correlations are also found with cardiovascular and pulmonary hospital admissions, in particular in asthmatic children[39]. These correlations occur in the context of the pollutant mix of urban aerosol. The impact of sulfate particulates may contribute to these results. In the American cities cohort studies, the mortality decrease associated with lower exposure to PM2.5 particles between 2002 and 2007 is selectively correlated to a reduction in sulfates[40].
The role of nitrogen oxides is under discussion. NO is not toxic, it is a mediator of many biological responses; in the atmosphere, it changes rapidly into toxic nitrogen dioxide, NO2, but the levels reached only rarely arrive at the toxicity threshold for humans, namely 0.2ppm (about 400 µg/m3) when it is inhaled alone. However, NO2 appears as a significant cofactor associated to the particulate matter phase, involved in the developmental disorders of the pulmonary functions in the child, with a deficit concerning 7% of the population per 10 µg/m3 NO2 increase in urban atmospheres[41]. NO2 is constantly associated to all-cause mortality and to cardiopulmonary mortality in epidemiological studies; while the results are not as consistent regarding cardiovascular effects[42]. As for a connection with lung cancer, the results are inconsistent but the meta-analysis[43] leads to evaluating a 4% excess per 10 µg/m3 NO2, without any other evidence than a correlation with a ubiquitous urban pollution indicator. In addition, nitrogen oxides participate in the formation of ozone and of toxic peroxyacetyl nitrates (PANs) via a photochemical reaction. Nevertheless, it is generally admitted that the toxicity of nitrogen oxides is essentially due to the nucleation of nitrates, the main constituents of the fine particulate matter phase.
Ozone and the particulate matter phase compose the 2 toxic constituents that are most consistently involved in diseases attributable to air pollution.
The health effects of atmospheric ozone can be distinguished from those of particulate matter pollution because their peaks are often separate; yet, a thermal covariable is constantly associated to them, complicating the evaluations. Additionally, ozone and NOx are closely related.
The toxic effects of ozone alone can be detected in humans starting from 120 µg/m3, specifically via biological markers, such as lipid oxidation products of the alveolar membrane film and the quantitative analysis of endogenous NO in the exhaled air. These two markers point to a local inflammatory reaction.
Based on hospital admissions linked with ozone peaks, a toxic effect threshold has been proposed, namely between 80 and 100 µg/m3 but this is in dispute. The shape of the dose-effect relation is complex, with an inflection that points to an adaptation to high concentrations.
The most recent synthesis of the Revihaap WHO document[44] concerning ozone's short-term effects, ensues from the combination of the APHENA European and American data. The results imply that for a 10 µg/m3 increase of the ambient concentration levels, the following are found: 0.18% excess all-cause mortality; 0.22% excess cardiovascular mortality in persons over 75 years of age; 0.35% excess cardiovascular mortality in younger persons; 0.19%, excess pulmonary disease mortality with an equivalent increase of hospitalizations in people older than 65.
The long-term effects of ozone exposure are under debate. At present, the meta-analysis of the data does not allow to conclude that there is a specific effect due to long-term exposure to ozone[45].
The particulate matter phase, with a variable expression according to the granulometric cut-off level: PM10 for particle sizes under 10 µm, PM2.5 and PM1 under 2.5 µm and 1 µm respectively; and, ultra-fine, nanometric particles or various substitutes such as ‘’black smoke’’, does not constitute a defined class of toxic substances, in so far as the chemical composition and physical properties of their constituents vary widely. The fact remains that these particles can be, with certainty, linked to a common toxic effect that is directly brought to light by correlations with the daily variations of inflammation markers. The same applies to correlations with oxidative stress and electrocardiogram (ECG) alterations[46]. In the recent study by Pope et al 2016[47], the PM2.5 pollution peaks observed over a period of 3 years in, healthy, nonsmoking, young adult volunteers correlate with signs of vascular cell suffering, with decreased revascularization factors, with augmented circulating monocyte and T lymphocytes, all of which are factors related to delayed cardiovascular pathologies.
When the studies allow the distinction between PM10 and PM2.5, they find that PM10s have a strong impact on the short-term effects involved in pulmonary pathologies of the superior respiratory tract but not in bronchioles. This can be explained by the small deposition in the lower airways. While the cardiovascular effects of the 2 types of particles are comparable in short-term studies, the long-term impacts of PM10s on cardiovascular mortality is not established, as opposed to that of PM2.5, whose deposit reaches the highly vascularized bed.
Among the variable constituents of PMs, the presence of elemental or organic carbon has been kept under scrutiny. The conclusions of the WHO (Revihaap[48]) are that carbon particles per se, are not toxic but that they serve as a choice adsorption vehicle for various toxic substances affecting the lungs. directly or from a distance. Particle sulfates share this property. Note, however, that ultrafine carbon particles have a proven direct action on both heart rate and electrocardiogram.
Urban aerosol contains a contingent of various, ultrafine particles at the nanometric scale whose various organic and inorganic toxic components are more abundant than in the global aerosol composition. The specific properties of nanoparticles allow them to escape capture by macrophages and to spread into the blood and various organs such as the heart, kidney, or brain. These properties raise the suspicion that ultrafine particles may have a significant impact in air pollution pathologies, but no epidemiological studies are available that would allow to evaluate this.
A very significant portion of the particulate matter phase is composed of nitrates and sulfates that are formed from NO2 and SO2. Clinical and toxicological studies do not allow to attribute to them a toxic potential at the levels they reach in the environment. Nonetheless, as urban aerosol constituents, they have been associated to various pulmonary and cardiovascular pathologies. Yet, the results are unreliable; somewhat more robust for sulfates than for nitrates. One of the hypotheses retained to explain their toxic role is their combination with metallic and organic toxins such as PAHs (Revihaap).
Although metals are involved in the generation of radical oxidants, toxicological studies have not allowed to identify metals specifically associated with air pollution-induced pathologies[49] . However, a correlation has been uncovered between nickel concentration and various temporary alterations of the cardiac function and the copper–zinc–vanadium group has been associated to a temporary elevation in blood fibrinogen. In epidemiological studies regarding cancer and Cu, Fe, K, Ni, S, Si, V and Zn elements in PM10 and PM2.5, correlations were found with all these elements except for vanadium; sulfur and nickel present the stronger correlations[50].
Various studies characterize the health impact of the particulate matter phase as a function of the original carbon-based source of energy. In the study of the 6 US cities, the sources derived from oil, as well as those derived from coal, are correlated with mortality; whereas, the particles issued from crustal erosion are not[51]. In the recent study of 100 urban areas in the USA, the share of particulate matter arising from coal combustion in PM2.5 particles was found to be 5 times more pernicious than the average of PM2.5[52] in terms of death from ischemic heart disease. This study found no link with PM2.5 originating from crustal soil erosion or biomass combustion. Generally, there is an ongoing debate on biomass combustion, whose tight link to the negative effects of domestic pollution (Revihaap), is affected by the flimsy correlation of daily mortality and temporarily elevated PM2.5 concentrations due to large forest fires[53].
The toxic mechanisms evidenced after the inhalation of urban aerosol particulate matter, involve oxidative stress as well as various reactions of the independent nervous system. This results in a cascade of inflammation mediators specifically targeting vascular cells. The effects at a distance from the pulmonary entry pathways are explained by the solubility of the toxic components and, in the case of ultrafine particulate matter, their migration.
Except for genotoxic agents, that are liable to randomly alter DNA at very small doses, and participate in tissue cancerization, no toxicological mechanism allows to consider there is no threshold for the effects on morbidity and on pulmonary and cardiovascular mortality, even when considering the existence of at-risk groups. Yet, within the environmental particulate matter exposure range, namely between 5 and a few tens of µg of PM2.5 /m3; and considering the large measurement uncertainties, things are as if the exposure to effect relation could be considered as linear with no threshold.
In fact, when the high exposure data are included, linearity does not hold, and more complex relationships, with a substantial reduction for strong exposures must be envisaged[54]. Thus, it is likely that the shape of the concentration-response is, in truth, a rapid increase beyond a threshold of less than 5 µg/m3[55] followed by a practically linear increase, to rise more slowly when high exposure levels are reached, tending towards a semi logarithmic relation. This is shown on Figure 5, where the relative risk of developing pulmonary and cardiovascular diseases is presented versus a logarithmic scale, expressing the total amount inhaled, whether from urban aerosol and passive (or second-hand) smoking, or active smoking. In addition, this figure shows similar responses to very different aerosols, supporting the argument that the particulate matter phase should be considered generically toxic.
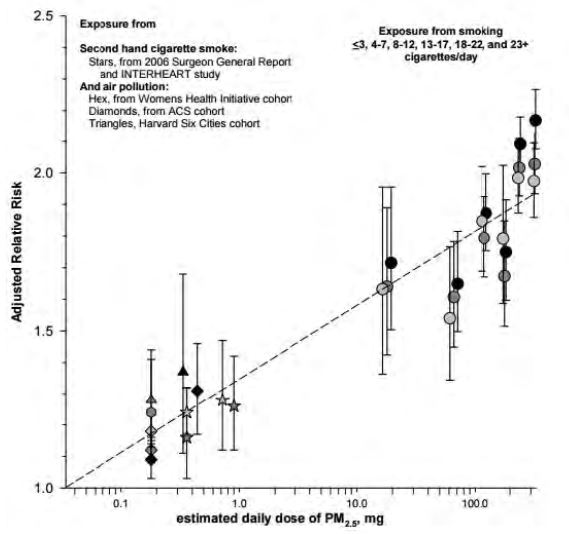
Fig 5. Pope et al 2011[56]. Shape of the exposure relation between the relative risk coefficient and the logarithm of the total daily amount inhaled from urban aerosols and passive smoking (on the left) and active smoking (on the right), for different pulmonary and cardiovascular diseases.
- 2-2-2-5. Hypotheses Made for the Evaluation of the Consequences on Health of Different Carbon-Based Sources of Energy.
The exposure-response relation that characterizes the mortality and morbidity associated with air pollution is used to evaluate the impact specific to each carbon-based source of energy. The basic hypothesis is that the toxic pollutants involved are common to the different sources and can be modeled from a few constituents. This work was developed by the ExternE (External costs of Energy) European work group from 1995 to 2005 and, to a lesser degree but with the same methodology, in the United States[57].
The essential part of the health impacts is attributed to particles expressed in PM10, for acute effects, and in PM2.5, for chronic effects. The acute effects of ozone, which can be differentiated from those of particulate matter, are added and the systemic effects of metals and toxic organic compounds are also considered although these hardly modify the overall impacts[58].
From this perspective, the health impact of SO2 and NOx is considered only insofar as they are sources of particulate matter. Although there are no toxicological data that would allow an evaluation of their potential, a review of the literature available convinced ExternE to decide that: nitrates have 0.5 times the toxicity of PM10 and sulfates have the same toxicity as PM10 , these having 0.6 times the toxicity of PM2.5. It was also agreed that the primary particles from power plant chimneys were equivalent to PM10 while those emitted by mobile sources in road traffic have 1.5 times the toxicity of PM2.5. Moreover, the evaluation of the health impact requires modeling the atmospheric dispersion of the pollutants from their source of emission to distances of several thousand kilometers, while considering the specific characteristics of each installation. These pollutants are transported by the wind and diluted by atmospheric turbulence until they are deposited to the ground by either dry or wet diffusion (rain).
As primary aerosols are not significantly altered at less than 50 km from their source of emission, ExternE uses a simple, Gaussian straight-line propagation model. However, at larger distances, chemical reactions occur in the atmosphere to form secondary pollutants such as ozone, sulfates and nitrates whose behavior is approached with more complex Lagrangian models. Moreover, the characteristics of massive, local, stationary emissions from power plant chimneys need to be modeled differently from those of mobile sources
The validation of these models has been possible in certain circumstances thanks to actual measurements. Variations on the order of a factor 2 have been observed [59].
The synthesis obtained from these models gives an evaluation of the cumulative damage expected according to the distance from the emission source (Fig.6).
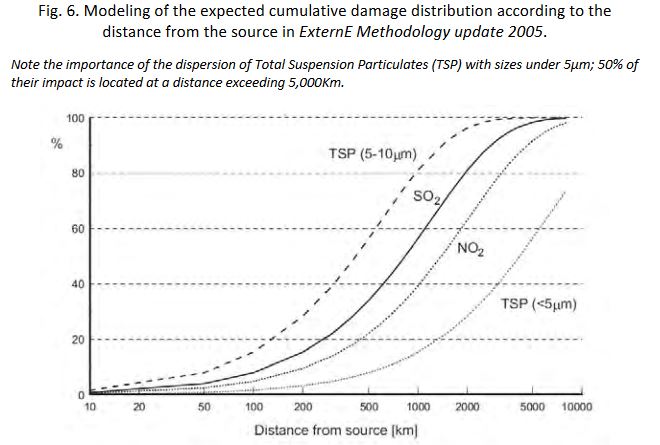
Note the importance of the dispersion of Total Suspension Particulates (TSP) with sizes under 5µm; 50% of their impact is located at a distance exceeding 5,000Km.
For systemic pollutants the modeling must be more thorough so as to include deposits to the ground as well as transfers to water and various levels of the food chain. Indeed, for some toxic pollutants, ingestion may constitute the main impact pathway (As, Hg, Pb, dioxins). On the other hand, the carcinogenic effects of formaldehyde, CrVI, Ni and Cd are observed only after inhalation; taking into consideration their action on the food chain would not be justified[60].
- 2-2-2-6. Health Impact of Carbon-Based Sources of Energy
The quantification of the health impact requires choosing the relevant parameters, whether exposure-effect or concentration-effect. For particulate matter and ozone, these parameters originate from air pollution epidemiology. They are derived from a linear no threshold[61] relation applied to the in-air concentration versus morbidity and mortality.
Among the possible values, ExternE 2005 selected the following:
For acute impacts observed within a few days after exposure:
A mortality increase of 0.6% per additional 10µg/m3 of PM10
A mortality increase of 0.3% for a 10µg O3 increase averaged over 8 hours
For infant mortality in the first year of life:
After exposure in the first two months of life: a 4% increase per 10µg/m3 of PM10.
For chronic effects:
A mortality increase of 5% per additional 10µg/m3 of PM2.5. This evaluation includes mortality induced by acute effects.
In terms of morbidity several health markers are available for PM10s per 10 μg/m3 and per year:
- New cases of chronic bronchitis: for 100,000 adults: 26.5 cases.
- Hospital admissions – for respiratory diseases: 7.03 cases per 100,000 individuals among the general public; - 4.34 cases for hospital admissions in cardiology.
- Number of doctor’s appointments for asthma: among 1000 patients: 1.18 for children aged 0-14; 0.5 for ages 15-64; and 0.95 for adults aged 65+.
- Number of doctor’s appointments for upper respiratory diseases among 1000 patients: 4 for children aged 0-14; 3.2 for ages 15-64; and 4.5 for older persons.
- Annual number of days of bronchodilator use in 1000 asthmatic patients: 180 for children aged 5-14 and 912 for confirmed asthmatic adults.
- Symptom worsening in adults with chronic respiratory diseases: 30% increase.
And for effects that are attributable to ozone, with an 8-hour mean exposure per year and per 10 μg/m3:
- Hospital admissions per 100,000 adults aged 65+: 11.5.
- Doctor's appointments for allergic rhinitis per 1000 patients: 3 for children aged 0-14 and 1.6 for adults aged 15-64.
- Annual number of days of bronchodilator use in 1000 asthmatics: 310 for children aged 5 – 14; 730 in confirmed asthmatic adults aged 20+.
In addition to these effects that have been directly evidenced by epidemiology, modeling shows that others can be expected. ExternE recommends using the EPA-IRIS parameters for the assessment of systemic carcinogens.
In the case of lead (Pb) for which the confirmed risk is an IQ point decline proportional to the amount absorbed during the first two years of life, the parameter retained is 0.014 IQ points per year per µg/m3 per person in the general population. This assessment allows for the proportion of the population aged under two and the coefficient that correlates lead concentration in the air to blood lead concentration; it also includes the contribution from ingestion following deposits on the ground.
- 2-2-2-7. Evaluation of the Loss of Life Expectancy
In most cases, the health damage indicators are expressed in relative risk by comparing the ratio of observed cases after exposure to an excess concentration of the toxic component considered to the number of existing cases without this excess exposure.
The relation of mortality to PM2.5 concentration in Europe can be rendered[62] by a simple linear log function: ΔY = Y0 - (1-e-βΔX) where ∆Y is the decrease in the number of deaths which would be associated to a ΔX decrement in PM2.5 concentration; β is the slope of the logarithm of mortality versus PM2.5 concentration; in the case of a relative risk RR, observed for an exposure to 10µg/m3 the value is: β = ln(RR/10).
The probability of mortality decrease per age group is, itself a function of the same e-βΔx factor. By using mortality charts that give survival probabilities per age bracket, it is possible to calculate the expected life-expectancy gains per avoided exposure; these are generally expressed as a life expectancy gain at age 30. The evaluation of impacts on child populations requires a different approach.
ExternE uses a slightly different method with results that are comparable to those derived from the use of mortality charts. This results in a simplified expression[63] with a proportional relation of the PM2.5 concentration to the years of life lost within the range of usual exposure levels. Despite the non-linear factors that determine it, this property allows the definition of a generic value for Europe, namely 0.22 days of life lost per 1-year exposure to a 1µg/m3 excess.
A synthesis was proposed for all of Europe exposed to carbon-based energy fallouts, taking into account the density of the populations affected by the local dispersion of the plume in addition to the data derived from the regional model, Table 6.
Table 6. Mortality impact of carbon-based energies in Europe in 1998: NewExternE 2004[64]
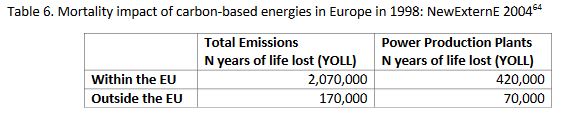
For a total of 2.2 million years of life lost, with a loss per case evaluated at 5 years, these figures correspond to about 450,000 premature deaths for the year 1998.
- 2-2-2-8. Damage Distribution According to Distance
The impacts of the emissions beyond the emitting source borders can be evaluated fixed sources, as was done for coal-fired power plants in Europe, based on measurements at the source and local and regional dispersion modeling (see Table. 7)
Table 7- Premature deaths attributable in 2013 to various European coal-fired power plants. Each line shows the contribution of the various countries to premature deaths in the country considered. The figures displayed against an orange background highlight instances with more than 50 excess premature deaths; the blue boxes show each country’s contribution to its own total premature deaths: Europe’s Dark Cloud 2016[65].
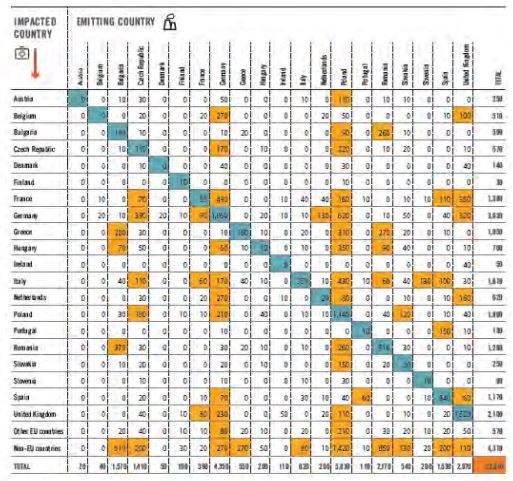
Most of the health impacts related to other types of energy, apart from those of accidental situations, result from the utilization of carbon-based sources of energy during their life cycle.
The distinctive characteristic of the wind and photovoltaic sectors is the heavy health burden that heavy metals involved in their implementation represent.
The comparative significance of the different agents of health damage for the various sectors, in particular the carbon-free sectors, was evaluated in NewExternE 2004. This is shown in Table 8, which does not provide information on the relative harm caused by the different sectors but gives, for each of them, the relative importance of the associated toxic pollutant contributions.
Table 8. Respective share of 100% of the health damages attributed to primary pollutants from different sources of energy according to NewExternE 2004. 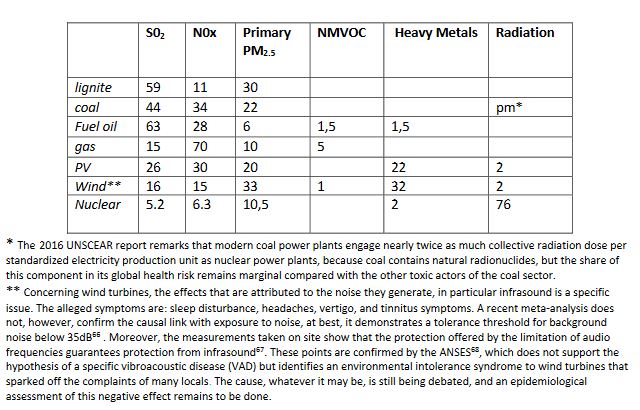
* The 2016 UNSCEAR report remarks that modern coal power plants engage nearly twice as much collective radiation dose per standardized electricity production unit as nuclear power plants, because coal contains natural radionuclides, but the share of this component in its global health risk remains marginal compared with the other toxic actors of the coal sector.
** Concerning wind turbines, the effects that are attributed to the noise they generate, in particular infrasound is a specific issue. The alleged symptoms are: sleep disturbance, headaches, vertigo, and tinnitus symptoms. A recent meta-analysis does not, however, confirm the causal link with exposure to noise, at best, it demonstrates a tolerance threshold for background noise below 35dB[66] . Moreover, the measurements taken on site show that the protection offered by the limitation of audio frequencies guarantees protection from infrasound[67]. These points are confirmed by the ANSES[68], which does not support the hypothesis of a specific vibroacoustic disease (VAD) but identifies an environmental intolerance syndrome to wind turbines that sparked off the complaints of many locals. The cause, whatever it may be, is still being debated, and an epidemiological assessment of this negative effect remains to be done.
The results of European and American overviews of energy externalities made it possible to rank the sectors according to the damages attributed per TWh. The results can be expressed years of life lost as in Rabl and Spandero[69] Table 9:
Table 9. Years of life lost per TWh after the year 2000 according to the different sources of energy in Europe
|
Coal |
Fuel |
Gas |
Nuclear |
Biomass |
Wind |
PV |
|
122 |
150 |
32 |
9 |
77 |
6 |
12 |
An equivalent per TWh study done in Sweden by Startfeld and Wickdahl[70] expresses its results in terms of the number of premature deaths as applied to Swedish emissions characteristics: Table 10.
Table 10 Number of Premature Deaths* in Sweden per TWh according to different energy sources.
|
Coal |
Lignite |
Fuel Oil |
Gas |
Nuclear |
Biomass |
Hydro |
Wind |
|
25 |
18 |
37 |
4 |
1 |
12 |
< 1 |
> 1 |
*ExternE considers an average of 5 years of life lost per premature death.
And for the United Kingdom, the more complete study by Markandya and Wilkinson[71] indicates the number of deaths and accidents as well as the number of serious diseases as shown in Table 11.
Table 11. Number of Premature Deaths, Lethal Accidents and Diseases per TWh in the United Kingdom according to different energy sources.
|
|
Coal |
Lignite |
Fuel Oil |
Biomass |
Gas |
Nuclear |
|
Number of Accidents |
0.12 |
0.12 |
0.03 |
--- |
0.02 |
0.02 |
|
Number of Deaths |
24.5 |
32.6 |
18.4 |
4.6 |
2.8 |
0.05 |
|
Number of Diseases |
225 |
298 |
161 |
43 |
30 |
0.22 |
In 2012, in the United States, the Forbes magazine published an evaluation without quoting its sources, that attributed the following numbers of premature deaths per TWh of electricity produced per energy sector: 15 for coal, 36 for oil, 4 for gas, 24 for biomass, 0.4 for solar, 0.15 for wind, 1.4 for hydraulic and 0.09 for nuclear. Barring a few exceptions these data are comparable to those issued from ExternE within a factor of 2.
In terms of effects on health, the choices of energy supply mix strongly affect global impacts. Taking the risk coefficients per TWh calculated by Rabl and Markandya, the comparison of the expected impacts from the production of electricity in 2015 would forecast: in France (546 TWh) 7,300 years of life lost and 460 premature deaths and in Germany (647 TWh) 41,300 years of life lost and 8,400 premature deaths.
A great number of unknowns remain regarding the quantification of health damage attributable to different sources of energy.
Regarding nuclear energy, it is mostly the validity of the extrapolations of risks for doses far below natural radioactivity that may justify reevaluations. However, the well-known exposure levels and the long-standing validation of the dose-effect relation, allow a global risk estimate that is unlikely to be questioned when what is at issue is the ranking of risks.
Nuclear accident management does, nevertheless, raise an unresolved issue: the evaluation of indirect harm to health associated in the long-term with the disorganization of health care systems, and with the impacts of deficiencies and psychopathological effects attributable to the social chaos left in the wake of the catastrophe. Because this was not taken into account at Chernobyl, the way was left open, in the media and among certain dissident scientists, for a confusing evaluation of the causes of health deterioration in the regions affected by the accident. The outcome of these indirect effects can be extremely serious, it exceeds by far the radiation-induced impacts on health. This lesson was kept in mind at Fukushima where the population was promptly taken care of. This attitude and the implementation of sufficient means of assistance and epidemiological control should allow a better evaluation of the cost of this component of the health risk specific to nuclear facilities.
For carbon-based sources of energy, the main evaluation difficulty stems from lack of knowledge concerning the interactions between air pollutants. No doubt that urban air pollution is responsible for about one in every nine premature deaths, the loss of 9 life expectancy months and is also related to an increase in morbidity in Europe[72]. But, the challenge remains, not only to identify all the primary causes, but also, to determine for each respective source of particulate matter and gases, its own degree of toxicity, while the toxicity is observed only within the context of variable mixtures of these with natural and anthropogenic constituents of a different nature.
It is likely that this uncertainty is the source of the sometimes inconsistent evaluations concerning health impacts. The direct proofs of the involvement of sulfates are relatively weak and those of nitrates are non-existent, leading to a delicate situation, since sulfates and nitrates constitute up to 80% of the impact attributed by way of their contribution to PM10 and PM2.5. In fact, we have no exposure marker that would also be an impact indicator allowing optimized prevention by selectively eliminating the most toxic component(s) involved.
However, all these uncertainties do not affect the general ranking of health costs associated to the different energy production sectors, so much larger is the cost due to carbon-based energies as compared to that of the other sectors. This cost anticipates a number of deaths on the order of 100 million premature deaths world-wide for a period of exposure corresponding to a complete lifespan. This cost is large enough to significantly impact the cost of carbon-free energies upstream and downstream from their production, particularly during iREL intermittence.
Regardless of how the damages manifest themselves, considering accidents as well as normal operating conditions, considering the heavy price paid by professionals and the general public, coal and oil are responsible for hundreds of thousands of deaths per annum in Europe, exceeding by far the other sectors. In comparison, nuclear and renewable energies are the leading role models in the industry; gas and biomass are at an intermediate level.
Mortality due to accidents, however catastrophic it may seem at the time, represents only a small share in the overall number of deaths: less than 0.5 % of (delayed) premature deaths caused by the energy sector mainly due to fossil fuels and nuclear power, the other sources of energy contributing a negligible amount. Thus, only by the delayed mortality evaluation is it possible to truly compare the level of hazard associated with each source of energy.
Per unit of energy produced, it appears that nuclear power contributes considerably less to delayed mortality than fossil fuels. One of the reasons for this is that the adverse effects of the nuclear sector occur only with serious accidents associated with significant radioactive contamination; whereas fossil fuels permanently contribute to delayed mortality due to the simple fact that using them entails air pollution.
In both cases, the evaluation of this delayed mortality is based on concentration-response relations resulting from epidemiological studies. For a radioactive contamination, the slope of this concentration-response is evaluated at 5% per sievert of effective dose. For air pollution, using the PM2.5 marker, the slope is about 5 % per 10 µg/m3 concentration of PM2.5 in air. This means that living for 50 years in an atmosphere of 15-20 µg/m3 of PM2.5, as is the case in large French cities, is about equivalent in terms of delayed mortality as living for 50 years in an area contaminated by a radioactivity of 20 mSv per annum.
Acknowledgments: This work benefited specifically from the invaluable contributions of Bernard Durand and André Aurengo as well as the constant vigilance and advice of Jean Pierre Schwartz, Hervé Nifenecker, Gilbert Ruelle, Frédéric Livet, Henri Prévot and Jean Marie Seiler. The translation to English of the French original is due to Elisabeth Huffer and Ghislaine Mc Cawley,
[1] Subsidies and costs of EU energy 2014.
[2] Hirschberg et al.: Severe accidents in the Energy Sector 1st Edition Swiss Federal Office of Energy 1998
[3] Burgher P., Hirschberg S.: Comparative risk assessment of severe accidents in the energy sector. Energy Policy, 74, 2014, S45-S56.
[4] In this text, GWe.time unit and TWe.time unit always refer to the energy produced and not to the energy consumed.
[5] The evacuations of more than 200 persons resulted from: 65 accidents from oil, 28 from LPG, 18 from natural gas, 3 from hydro dams, 2 from nuclear. Altogether, evacuations affected more than 1 million 500,000 residents. Among the larger evacuations, we find: for LPG: 220,000 evacuees in 1979 at Mississauga Canada and 200,000 in 1984 in Mexico City; for hydroelectricity: 150,000 evacuees in 1979 in Moravi, India; for nuclear energy, 144,000 evacuees in 1979 in the USA, at TMI and 135,000 in 1986 in Ukraine, Chernobyl; for oil, 100,000 evacuees in 1988 at Mexico City.
[6] There is data relative to photovoltaic accidents, according to the techniques used (Fthenakis et al. Solar Energy, 85,1609, 2011). These concern about a hundred deaths, yielding normalized rates in the order of 10-3 per GWe.year, to which deaths incurred while installing the panels on roofs should be added, but there is no global evaluation of these. There is no complete data base for accidents in the wind power sector; despite diverse accidental material damage, human accidents are rare. In a Los Angeles Times review dated 08/03/2011, 78 fatal accidents are reported to have occurred between 1970 and 2010, half of which happened in the USA. In the offshore wind sector, 959 accidents were reported in 2014 in Northern Europe, justifying 44 work days off; although no fatal accident was recorded (Environment et technique 348, 2015 – Environment and Technique 348, 2015). The most complete inventory is given in the Caithness Windfarm forum 2017 compendium and concerns 2,057 accidents and 130 deaths worldwide http://caithnesswindfarms.co.uk/accidents.pdf, but these statistics, according to the authors, could cover less than 10% of the real accidents.
[7] A 0.2% per Sv risk of transmittable genetic disease occurrence is added to the liabilities of exposure, even though no such link has been established epidemiologically.
[8] The number, 33,000 deaths from cancer, was derived from the assessment of a worldwide collective dose amounting to 600,000 man.sieverts obtained from the 2006 TORCH report subsequent to the Chernobyl forum. The risk coefficient retained, regardless of the dose, is 5% fatal cancers per Sv. The 2008 revision of the UNSCEAR report reaches, in fact, a global collective dose of 300. 000man.Sv, which should lead to a maximal estimate of 15,000 fatal cancers, according to the linear no threshold model.
[9] United Nations Scientific Committee on the effect of Atomic Radiation: Sources and Effects of Ionizing Radiation United Nations 2008.
[10] The Japan Times, Feb 20 2014.
[11] Samet J, Chanson D . Fukushima Daiichi Power Plant Disaster: how many people were affected, 2015 Report.
[12] IRSN Méthodologie appliquée par l’IRSN pour l’évaluation du coût d’accidents nucléaires en France, PRP-CRI/SESUC/2013-00261, 2013. (Describes the methodology used by IRSN to estimate the cost of potential nuclear accidents in France).
[13] Yablokov et al: Chernobyl consequences of the catastrophe…Ann Acad Sci NY 181, 2009.
[14] OECD Electricité nucléaire : Quels coûts externes, NEA 4373, OECD 2003.
[15] Rabl A Spandaro J : Les coûts externe de l’électricité, revue de l’énergie, 525, 151, 2001.
[16] United Nations Scientific Committee on the effect of Atomic Radiation: Sources and Effects of Ionizing Radiation United Nations 2000.
[17] Becker K: Health Effects of High Radon Environment Non-linearity in biology toxicology and medicine, 1, 3, 2003.
[18] Rage E et al. Cohorte française des mineurs d’uranium, Archives des maladies professionnelles et de l’environnement, 74,669, 2013.
[19] Richardson D et al: Risk of cancer from occupational exposure to radiation, doi: 101136/bmj/h5359.
[20] Rosental PA. La silicose comme maladie professionnelle transnationale. Revue Française des Affaires Sociales 2008/2 La Documentation Française.
[21] Coal workers pneumoconiosis in Germany, HealthGrove global Health Statistics 2017.
[22] HSE, Coal workers pneumoconiosis statistics 2017.
[23] Huang Irène in Santé et travail à la mine, Judith Rainhorn, Presse Universitaire le Septentrion, 2014 pages 207-234.
[24] Ref.: Bernard Durand personal communication
[25] Pascale M et al: Changement climatique et santé. Bulletin Epidémiologique Hebdomadaire 38-39, 718, 2015.
[26] Jacobson M: On the causal link between carbon dioxide and air pollution mortality. Geophysical Research Letters, 35, L03809, 2008.
[27] Laden F et al: Association of fine particulate matter from different sources with daily mortality in 6 US cities. Environ Health Perspect. 108, 941, 2000; Thurston G Heart: disease mortality and long-term exposures to source related components of US fine particle air pollution. EHP, 124, 785, 2016.
[28] Pope CA: Health effects of particulate matter air pollution EPA wood smoke webinar, July 28, 2011.
[29] Pope CA: Health effects of particulate matter air pollution EPA wood smoke webinar, July 28, 2011.
[30] Pope CA et al. Fine particle air pollution and life expectancy in the United States, New England Journal of Medicine, 360, 376, 2009.
[31] Hoek et al. Long-term air pollution and cardio-respiratory mortality. Environmental Health 12, 43, 2013.
[32] COMEAP Committee on the medical effects of air pollution. The mortality effects of long term exposure to particulate air pollution in the UK, 2010.
[33] Santé publique France. Impact de l’exposition chronique aux particules fines 2016.
[34] Hamra G et al.: Outdoor Particulate Matter Exposure and Lung Cancer: A Systematic Review and Meta-Analysis, Environ Health Perspect 122, 906, 2014.
[35] Raaschou-Nielsen O et al.: Particulate matter air pollution and lung cancer Environ Int 87, 66, 2016.
[36] Brook et al.: Particulate matter air pollution and cardiovascular disease. Circulation, 121, 2331, 2010.
[37] Pope et al.: Exposure to fine particle air pollution is associated with endothelial injury and inflammation Circulation Research, doi: 10.1161/CIRCRESAHA. 116.329279, 2016.
[38] 10 mg/m3 for an 8-hour exposure.
[39] Revihaap : WHO Review on evidence of health effects of air pollution Report 2013 .
[40] Dominici F et al: Chemical composition of fine particulate and life expectancy Epidemiology 26, 556, 2015.
[41] Gauderman W et al.: The effects of air pollution on lung development N Engl J Med. Sep 9;351(11):1057-67, 2004.
[42] Fisher PH et al: Air pollution and mortality in seven million adults. Environ Health Perspect 123, 697, 2015.
[43] Hamra G et al: Lung cancer and exposure to nitrogen dioxide and traffic. Environ Health Perspect 123, 1107, 2015.
[44] Revihaap: WHO Review on evidence of health effects of air pollution Report 2013.
[45] Atkinson R et al: Long term exposure to ambient ozone and mortality. BMJ open 2016 6: e009493.
[46] Brook et al: Particulate matter air pollution and cardiovascular disease. Circulation, 121, 2331, 2010.
[47] Pope et al: Exposure to fine particle air pollution is associated with endothelial injury and inflammation Circulation Research, doi: 10.1161/CIRCRESAHA. 116.329279.
[48] Revihaap : WHO Review on evidence of health effects of air pollution Report 2013.
[49] Lippman M Chen L.: Health effects of concentrated ambient particulate air matter and its components. Critical review in toxicology 39, 865, 2009.
[50] Raaschou-Nielsen O et al.: Particulate matter air pollution components and risk for lung cancer. Environ Int. 87, 66, 2016.
[51] Laden F et al: Association of fine particulate matter from different sources with daily mortality in 6 US cities. Environ Health Perspect 108, 941, 2000.
[52] Thurston G: Heart disease mortality and long-term exposures to source related components of US fine particle air pollution. EHP, 124, 785, 2016.
[53] Zu K. et al: Long range fine particulate matter from the 2002 Quebec forest fires and daily mortality in Greater Boston and New-York city. Air Qual Atmos Health, 9, 213, 2016.
[54] Nasari M; et al.: A class of nonlinear exposure response models suitable for health impact assessment applicable to large cohort studies of ambient air pollution. Air Qual Atmos Health, 9, 961, 2016.
[55] Brook et al: Particulate matter air pollution and cardiovascular disease. Circulation, 121, 2331, 2010.
[56] Pope CA: Health effects of particulate matter air pollution EPA wood smoke webinar, July 28, 2011.
[57] Synthesis in Hidden costs of Energy: Unpriced consequences of energy production and use. National Academy of Science 2009.
[58] ExternE: Externalities of Energy, Methodology Update EUR 21951, 2005.
[59] ExternE-Pol: Final technical Report, Rabl A Spandaro J coordinators, 2nd version Aug 2005.
[60] ExternE: Externalities of Energy, Methodology Update EUR 21951, 2005.
[61] In the case of ozone, no data under 100µg/m3 are available and the WHO recommends that only periods of exposure above 70µg/m3 (35ppb) be considered.
[62] Santé Publique France : Impacts de l’exposition chronique aux particules fines sur la mortalité en France continentale et analyse des gains de santé de plusieurs scénarios de réduction de la pollution. 2016.
[63] Leksell I Rabl A.: Air pollution and mortality: quantification and valuation of years of life lost. Risk Analysis, 21, 843, 2001.
[64] NewExt: New Elements for the Assessment of External Costs from Energy Technologies. Friedrich R coordinator Final Report Sept 2004.
[65] Europe’s Dark Cloud How coal burning countries are making their neighbours sick. 2016.
[66] Schmidt JH et al: Health effects related to wind turbine noise exposure: a systematic review.PLOS One, doi: 10.1371/journal.pone.01114183.
[67] Berger M et al.: Health based audible noise guidelines account for infrasound…Frontiers in Public Health. Doi: 10.389/pubh.2015.
[68] ANSES : Evaluation des effets sanitaires des basses fréquences sonores et infrasons dus aux parcs éoliens. Mars 2017
[69] Rabl A Spandaro J : Les coûts externe de l’électricité, revue de l’énergie, 525, 151, 2001.
[70] Starfelt N Wikdahl CE Energy forum: Economic analysis of various options in electricity generation taking into account health and environmental effects. Proceedings of Ecological Aspects of Electric Power Generation Wasaw, Nov 14, 2001.
[71] Markandya A Wilkinson P.: Electricity Generation and Health. The Lancet, 370, 979, 2007.
[72] WHO Ambient air pollution: A global assessment of exposure and burden of disease. WHO 2014.